

Ever heard the phrase, “What gets measured gets managed?” It’s a bit of a cliché, but when it comes to your people, it’s spot on. Human resource analysis is all about taking that idea to heart—using employee and organisational data to make smarter decisions that actually move the business forward.
Think of it like a sports manager who doesn't just rely on gut feelings to pick a team. They dive into detailed player stats to build a championship roster. That's what HR analysis does for your workforce; it replaces guesswork with evidence.
What Is Human Resource Analysis

At its core, human resource analysis is the process of turning raw, people-related data into genuinely useful insights. It’s a methodical way of collecting, organising, and looking at information from every single part of an employee's time with you—from their first application right through to their exit interview.
This approach transforms HR from an administrative department into a strategic business partner. Instead of just reacting, you're getting ahead of the curve.
The Shift from Gut Feeling to Data-Driven Decisions
For a long time, many decisions about people were made based on anecdotal evidence or a manager's intuition. And while experience is valuable, it's not foolproof. It can be swayed by unconscious bias or just plain incomplete information.
HR analysis gives you an objective lens. For instance, if a key department has a high turnover rate, you might assume it's about pay. But the data could show the real problem is a lack of development opportunities or a specific manager's leadership style. By pinpointing the root cause, you can fix the actual problem instead of just patching over the symptoms.
Human resource analysis isn't about tracking people for the sake of it. It’s about understanding the systems and processes that help them—and the business—succeed.
What Does This Look Like in Practice?
So, how does this work day-to-day? It’s all about connecting different data points to tell a clear story about the health of your organisation. You’re essentially looking for patterns and turning them into actionable steps.
Here are a few key areas where this comes to life:
- Recruitment Efficiency: Are you finding the right people quickly and without breaking the bank? By analysing metrics like time-to-hire and cost-per-hire, you can fine-tune your hiring process. Actionable step: If your time-to-hire is high, review each stage of your recruitment pipeline to identify bottlenecks. Is a specific manager slow to review CVs? Is your interview scheduling inefficient?
- Employee Engagement and Retention: Looking at satisfaction survey scores alongside turnover rates can reveal exactly what keeps your best people motivated and, more importantly, what pushes them to leave. Actionable step: If engagement scores are low for a specific team, work with their manager to create a targeted action plan based on survey feedback.
- Performance and Productivity: Tracking performance data helps you understand what top performers have in common. Is it a particular training programme? A specific manager? This helps you replicate success across the board. Actionable step: Identify your top 5% of performers and analyse their training history. Use this to refine your learning and development programmes for everyone else.
- Workforce Planning: This is where it gets really powerful. Predictive analytics can help you forecast future staffing needs, flagging potential skill gaps before they become a problem and helping you plan for growth. Actionable step: Analyse your current workforce's skills against future business goals to identify gaps. Start a targeted upskilling programme to close them.
Ultimately, HR analysis gives you the clarity to build a more engaged, productive, and resilient team. You're simply making smarter decisions, backed by real evidence, at every turn.
Why HR Analysis Is a Game-Changer for Your Business
Let's move beyond the theory. HR analysis is where people data turns into real, tangible business results. It’s not about generating complex reports that sit on a shelf gathering dust; it's about making smart moves that improve retention, sharpen your recruitment process, and boost overall productivity. This is how HR stops being a cost centre and starts being a powerful engine for growth.
When you use data-driven insights, you stop guessing and start solving. Instead of just reacting to problems like a surprise spike in staff turnover, you can get ahead of them by spotting the root causes. This proactive approach helps you avoid costly hiring mistakes and builds a team that’s both stable and effective.
The diagram below really shows the direct line you can draw from HR analysis to achieving core business goals.
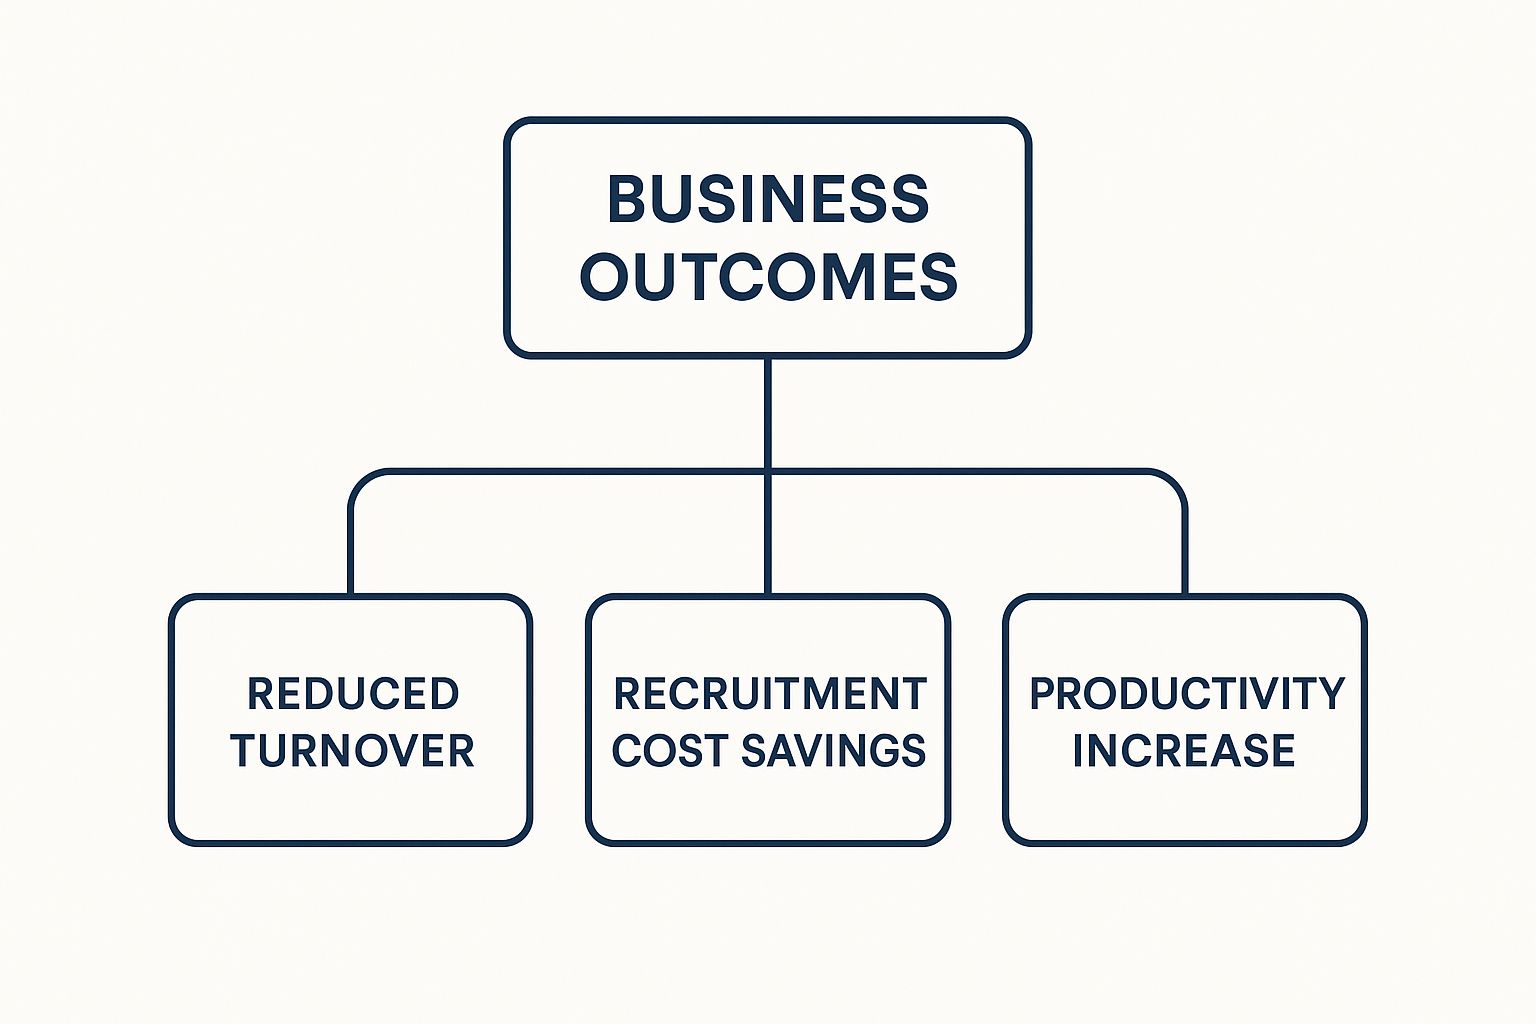
As you can see, it clearly connects the dots between digging into your workforce data and hitting key targets like cutting turnover, saving recruitment costs, and lifting productivity.
Reduce Costs and Improve Retention
One of the quickest wins you’ll see from HR analysis is the impact on your bottom line. Employee turnover is incredibly expensive—the cost to replace someone can be anywhere from half to double their annual salary. HR analysis gives you the tools to tackle this head-on.
Imagine you start analysing your exit interview data and a pattern emerges. Top performers in a specific department are consistently leaving around the nine-month mark, and they all mention a lack of growth opportunities. Armed with that specific insight, you can roll out a targeted career development programme for that team. That one, data-informed action could slash turnover and save you thousands in recruitment and training costs.
By turning raw numbers into a clear story, you can pinpoint issues before they become major problems. The result is higher employee satisfaction and a stronger, more committed workforce.
Streamline Recruitment and Strategic Planning
A slow or clunky hiring process can mean losing out on great candidates who get snapped up by your competitors. HR analysis helps you refine your entire recruitment strategy by answering some critical questions:
- Where do our best hires actually come from? Analysing source data might show that a particular job board or a university partnership consistently delivers your most successful long-term employees. Actionable step: Allocate more of your recruitment budget to the top-performing channels and reduce spending on those that yield poor results.
- How long does it really take to fill a key role? Tracking your time-to-hire metric helps you spot the bottlenecks in your process, so you can make it faster and more efficient.
- Are our job descriptions attracting the right people? Data can show you which keywords or role descriptions are leading to higher-quality applications. Actionable step: A/B test different job titles or descriptions to see which ones attract more qualified candidates.
This strategic thinking is especially vital in today's job market. For instance, current HR trends in the Netherlands show a major shortage of skilled candidates right alongside a growing demand for better employee well-being. Companies are now using data to build creative recruitment strategies and wellness programmes just to attract and keep people in a tight market, where an increase of 0.7% in jobs is expected.
Drive Productivity and Performance
Finally, HR analysis is what empowers you to build a genuinely high-performing culture. When you start connecting things like employee engagement scores to actual productivity metrics, you begin to understand what truly motivates your teams. For example, you might discover that teams whose managers hold regular one-on-one check-ins have 20% higher output. That’s a powerful insight. You can then train other managers to do the same, scaling that success across the entire organisation.
Here's a practical way to do this:
- Identify High-Performing Teams: Use performance data to pinpoint your most productive teams.
- Analyse Their Practices: Survey these teams and their managers to understand their work habits, communication styles, and meeting cadences.
- Create a Best-Practice Playbook: Document the key behaviours (like weekly one-on-ones) that correlate with high performance.
- Train and Implement: Roll out this playbook as a training module for all managers across the company.
The Essential Metrics and Methods for Great HR Analysis
To get HR analysis right, you need to master both the "what" and the "how." The "what" are the key metrics that act as your organisation's vital signs. The "how" are the methods you use to make sense of those signs and decide on your next move.
Think of it like a car's dashboard. Metrics such as cost-per-hire or turnover rate are your gauges—the speedometer, fuel level, and engine temperature. They give you a real-time snapshot of what's happening. The methods, on the other hand, are the diagnostic tools a mechanic plugs in to figure out why the check engine light is on and what needs fixing.
Let's start with the essential metrics you should be tracking, then we'll dive into the methods that bring that data to life.
Key Metrics Across the Employee Lifecycle
You don't need to track every single data point imaginable. Effective HR analysis is about focusing on the metrics that tell the most important stories about your workforce's health and performance. We can group these into a few critical areas that follow an employee's journey.
Recruitment Metrics
These numbers tell you how efficient and effective your talent acquisition process really is. Are you finding the right people, quickly and cost-effectively?
- Time-to-Hire: This is the number of days between posting a job and a candidate accepting the offer. If this number is too high, you’re likely losing top talent to competitors who can move faster.
- Cost-per-Hire: To get this, you add up all your internal and external recruitment costs and divide that by the number of new hires. It reveals the true financial investment required to bring fresh talent on board.
- Acceptance Rate: This is the percentage of candidates who say "yes" to a formal job offer. A low rate can be a red flag, pointing to issues with your compensation, culture, or even the interview experience itself.
Engagement and Performance Metrics
Once people are on board, these indicators gauge how connected they feel to their work and how productive they are.
- Employee Net Promoter Score (eNPS): Based on the simple question, "How likely are you to recommend this company as a place to work?" it provides a quick, powerful snapshot of overall employee loyalty and satisfaction.
- Productivity Rate: This can be measured in a few ways, like revenue per employee or units produced per hour. It’s a crucial metric that directly connects HR efforts to business output.
- Goal Completion Rate: Tracking the percentage of individual or team goals that are actually met shows how well performance is lining up with company objectives. This is often one of the most direct measures of effectiveness.
Retention Metrics
Understanding why people stay—and why they leave—is fundamental to building long-term stability and growth.
- Total Turnover Rate: This is the percentage of employees who leave the organisation over a set period. A high turnover rate is a major warning sign that needs immediate investigation.
- Average Tenure: This shows the average length of time an employee stays with the company. A healthy tenure often points to a stable and engaging work environment.
- Talent Turnover Rate: This is a more focused—and often more important—metric. It specifically tracks the turnover rate among your top performers. Losing your high-potential people is far more damaging than general attrition.
To give you a clearer picture, here’s a quick-reference table breaking down these essential metrics.
Key Human Resource Analysis Metrics at a Glance
A practical breakdown of essential HR metrics, their calculation, and the business insights they unlock.
| Metric | How to Calculate It | What It Tells You |
|---|---|---|
| Time-to-Hire | (Offer Acceptance Date) - (Job Posting Date) | The speed and efficiency of your entire recruitment pipeline. |
| Cost-per-Hire | (Total Recruitment Costs) / (Total Number of Hires) | The financial investment needed to acquire one new employee. |
| eNPS | (% Promoters) - (% Detractors) | A quick measure of employee loyalty and satisfaction. |
| Total Turnover Rate | (Number of Leavers) / (Average Number of Employees) x 100 | The overall stability of your workforce. |
| Talent Turnover Rate | (Number of High-Performers Who Left) / (Total High-Performers) x 100 | The health of your talent pipeline and leadership potential. |
By consistently tracking these numbers, you stop reacting to workforce problems and start proactively shaping a healthier, more productive organisation.
The Four Levels of Analytical Methods
Collecting metrics is just the start. The real value is unlocked when you apply different analytical methods to uncover deeper insights. These methods build on each other, taking you from simple observation to smart, strategic recommendations.
- 1. Descriptive Analysis (What Happened?): This is the foundation. It's all about summarising historical data to understand past events. Practical Action: Create a simple monthly dashboard in Excel or Google Sheets showing key metrics like turnover rate and time-to-hire.
- 2. Diagnostic Analysis (Why Did It Happen?): This is where you start digging for the root causes. If turnover spiked, cross-reference it with other data. Practical Action: Compare turnover data against exit interview comments or engagement survey scores for the same period to find correlations.
- 3. Predictive Analysis (What Is Likely to Happen?): Here, you use historical data and statistical models to forecast future outcomes. Practical Action: Analyse the profiles of employees who have left in the past year. Identify common factors (e.g., tenure, time since last promotion) to build a simple risk profile for current employees.
- 4. Prescriptive Analysis (What Should We Do About It?): This is the most advanced level, where analysis moves to action. Practical Action: Based on your high-risk employee profile, create a proactive retention plan. This could involve managers holding "stay interviews" with at-risk staff to discuss their career goals.
Understanding how these levels connect is key. The insights from your descriptive analysis often serve as the leading and lagging indicators that trigger a deeper diagnostic look. That diagnosis then feeds your predictive models, which in turn powers your prescriptive actions. It's a structured approach that transforms raw data into a clear roadmap for strategic HR.
How to Implement Human Resource Analysis
Getting started with human resource analysis can feel like a massive undertaking, but it’s entirely manageable when you break it down into clear steps. Think of it like building a house. You wouldn't start ordering furniture before you've laid the foundation and drawn up the blueprints.
A successful HR analysis programme works the same way. It begins with a solid plan, not just a pile of data. This roadmap will guide you from setting clear goals to delivering real insights that leadership can act on, making sure your efforts are focused right from the start.
Step 1: Start with Strategic Business Objectives
The most common mistake is diving straight into data without a clear purpose. Before you analyse a single number, you need to ask one critical question: "What business problem are we trying to solve?" This anchors your entire analysis to a real organisational goal.
For example, don't just say "we want to analyse turnover." A better objective is: "We need to reduce turnover in our sales team by 15% in the next fiscal year because it's costing us an estimated €200,000 in lost revenue and recruitment fees." This specific, measurable goal gives your analysis a clear direction and a built-in metric for success.
Without this focus, you just end up with interesting reports that aren't actionable. The key is to tie your HR goals directly to business outcomes.
The goal of human resource analysis is not to create reports; it's to drive business decisions. Start with the decision you want to influence, then work backwards to find the data you need.
Step 2: Identify and Gather Your Data
Once you have your objective, the next step is to figure out where the data lives. The good news is that it likely already exists within your organisation, scattered across different systems. Your first action is to conduct a simple data inventory.
Common data sources include:
- Human Resource Information System (HRIS): This is your go-to for employee demographics, tenure, salary info, and roles.
- Applicant Tracking System (ATS): Here you’ll find all your recruitment data, like time-to-hire, source-of-hire, and offer acceptance rates.
- Performance Management Software: This holds valuable data on goal completion, performance review scores, and manager feedback.
- Employee Engagement Surveys: These provide crucial sentiment data, like eNPS scores and feedback on company culture.
Actionable tip: Create a simple spreadsheet listing each business question (from Step 1), the data needed to answer it, and where that data is located. This map will become your guide. Data quality is everything. It’s far better to have a small, high-quality dataset than a huge, messy one that leads to flawed conclusions.
Step 3: Choose the Right Tools for the Job
You don't need a super expensive or complex system to get started. The right tool really depends on your budget, your team's skills, and how deep you need to go. For many organisations, the journey starts simple and evolves over time.
- For Beginners: Start with what you have. Microsoft Excel or Google Sheets are powerful enough for basic descriptive and diagnostic analysis. You can use pivot tables and simple charts to find initial insights.
- For Growing Teams: When you need more powerful dashboards, consider a business intelligence (BI) tool like Power BI or Tableau. Many offer free or low-cost versions to get started.
- For Advanced Needs: Dedicated HR analytics platforms like Visier or Workday offer advanced predictive features. These are best when you have a dedicated analytics function and clean, integrated data sources.
The key is to start with a tool that fits your current capabilities and delivers value right away.
Step 4: Analyse the Data and Visualise Findings
This is where you start connecting the dots. Begin with descriptive analysis to understand what happened. For example, calculate the turnover rate for the last quarter. Then, move to diagnostic analysis to understand why it happened. You might find that turnover was 30% higher among employees with less than one year of service.
Visualisation is absolutely crucial for making your findings understandable. A simple bar chart showing turnover by department is way more compelling than a table of numbers. Clear visuals help stakeholders quickly grasp the story your data is telling. Actionable tip: Use a "one chart, one message" rule. Each visual should communicate a single, clear insight.
Step 5: Communicate Insights and Recommend Actions
Your final step is to present what you've found to leadership. Don't just show them charts and graphs; tell a story. Structure your presentation for impact:
- The Problem: Start with the business objective you defined in step one.
- The Finding: Present the key data-driven insight you uncovered.
- The "So What?": Explain the business impact of this finding (e.g., cost, risk, opportunity).
- The Recommendation: Propose 1-2 clear, actionable next steps.
For example: "Our sales team turnover is 15% above the company average (The Problem). Our analysis shows 70% of leavers resigned within 90 days of completing their initial training (The Finding). This is costing us €200,000 annually (The So What?). We recommend implementing a mentorship programme and revamping the onboarding process to provide better support (The Recommendation)." This approach secures buy-in and demonstrates the true value of HR analysis.
Real-World Examples of HR Analysis in Action

Theory and metrics are a great starting point, but the real magic happens when you see human resource analysis solving actual business problems. It’s like the difference between reading a recipe and finally tasting the meal.
Let’s walk through a few scenarios to show how real organisations use their data to get to the bottom of some surprisingly common issues.
The Retailer Tackling High Turnover
A national retail chain was bleeding new hires. Their employee turnover rate was alarmingly high, especially within the first six months. Management’s gut instinct was to blame pay – they assumed they weren’t competitive enough.
But a closer look at the HR data told a completely different story.
By combining exit interview feedback with onboarding survey results, the HR team spotted a clear pattern. A huge number of departing employees said they felt overwhelmed and unsupported right from the start. The training felt rushed, and they never really connected with their teams.
Armed with this insight, the company made a few targeted changes:
- The onboarding programme was completely overhauled, extending it from a single week to a full month.
- A new mentorship system was rolled out, pairing every new hire with a seasoned team member.
- Managers got new training on how to run proper 30, 60, and 90-day check-ins.
The result? A 45% drop in first-year turnover in just twelve months. The problem was never about the money; it was about the experience. Human resource analysis gave them the clarity to fix what was actually broken.
The Tech Firm Predicting Resignation Risks
A fast-growing tech company wanted to stop being reactive. Instead of scrambling when a top engineer handed in their notice, they decided to use predictive analytics to spot employees who were a high risk of leaving.
Their analysis team built a model that looked at several data points:
- Time since an employee’s last promotion or pay rise
- Scores from employee engagement surveys
- The amount of overtime being worked
- Performance ratings from their manager
The model flagged people who fit the profile of other high-performers who had previously quit. This wasn't about punishment. Instead, managers were trained to use these flags as a reason to start a supportive conversation. They could talk about career growth, offer exciting new projects, or address burnout before it turned into a resignation letter. This proactive approach directly improved their ability to keep their best people.
HR Analysis in a Broader Economic Context
These specific examples also connect to wider market trends. Take the Dutch labour market, for instance, which has seen a major focus on full-time, stable employment. The Netherlands has kept a steady employment rate with thousands of full-time employees, even when the economy gets choppy.
This stability makes retaining skilled, permanent staff a top priority, which is why the predictive retention analysis used by the tech firm is so valuable for Dutch companies. It’s about protecting your most important assets. You can dig deeper into these labour market dynamics and what they mean for businesses. Learn more about the Netherlands' employment data on tradingeconomics.com.
Overcoming Common HR Analysis Challenges
Kicking off an HR analysis initiative is an exciting step, but let's be honest—it’s rarely a straight line from A to B. Just like any big change in a business, you're bound to hit a few bumps in the road. Knowing what these hurdles are ahead of time is the best way to build an analytics function that actually works and delivers real value.
The most common snag people hit right away is poor data quality. If your data is a messy mix of inconsistent, incomplete, or disconnected information spread across different systems, your analysis is doomed before it even starts. It's like trying to bake a cake with the wrong ingredients; no matter how great the recipe is, the result just won't be right.
Another frequent issue is a skills gap right inside the HR team. Your people might be brilliant with recruitment and employee relations, but they may not have the specific analytical chops needed to make sense of complex data. This can quickly lead to frustration and a lack of trust in the numbers being produced.
Addressing Data and Skill Gaps
To get a handle on poor data quality, start with a simple data audit. This just means mapping out all your data sources—your HRIS, ATS, survey tools, you name it—and creating a standard way for everyone to enter and manage information. Actionable Step: Create a simple "data dictionary" that defines each metric (e.g., "Time-to-Hire starts on the day the job is posted and ends on the day the offer is accepted") to ensure everyone calculates it the same way. This simple step creates one reliable source of truth.
When it comes to the skills gap, you don’t need to go out and hire a team of data scientists overnight. A more grounded approach works better:
- Accessible Training: Get your team started with training on basic data literacy. Show them how to use user-friendly tools like Power BI or even just the more advanced functions in your spreadsheets.
- Start Simple: Begin with descriptive analytics—figuring out what happened—before you try to jump into complex predictive models. Build your team's confidence with small, clear wins.
- Cross-Functional Collaboration: Team up with your IT or finance departments. They usually have people with deep analytical expertise who can offer support and guidance.
Navigating Resistance and Privacy Concerns
Even with perfect data and a skilled team, you might run into resistance from leadership or privacy concerns from employees. Some leaders are used to trusting their gut instinct and can be sceptical of data-driven insights. At the same time, employees might worry about how their personal data is being used.
Gaining trust is paramount. Be transparent with employees about what data you are collecting and why. Frame your human resource analysis as a tool to improve their experience—not to monitor them.
Actionable Step for Leadership: To win over sceptical leaders, present your first project as a pilot study focused on a specific, high-pain business problem. Connect your findings directly to business outcomes they care about (cost savings, revenue growth). A successful pilot is the best proof of concept.
Actionable Step for Employees: Create a one-page summary for employees explaining your HR analytics programme. Clearly state what data you're using, what you're trying to achieve (e.g., improve training, create fairer promotion processes), and how their privacy is being protected.
Finally, the modern workforce is always changing. Here in the Netherlands, for example, there's a growing preference for flexible work and a constant need for new digital skills. This creates both challenges and opportunities. As labour productivity becomes more tied to an adaptable workforce, using human resource analysis is essential for navigating these shifts effectively. You can find more insights into the future of the Dutch labour market on PwC's website.
Common Questions About Human Resource Analysis
Diving into HR analysis can bring up a few practical questions, whether you're just starting out at a small business or fine-tuning your strategy in a larger company. Getting straight answers to these common queries can make all the difference.
What Skills Does My HR Team Need for Analysis?
You don't need a team of data scientists to get started. Honestly, the most important skills are curiosity and critical thinking. The real magic happens when your team can ask the right business questions and connect the dots between data and what’s actually happening on the ground.
Beyond that, a good foundation in handling data is key. This really just means:
- Data Literacy: Being comfortable looking at a chart and spotting a trend.
- Spreadsheet Proficiency: If you know your way around Excel or Google Sheets, you’re more than ready to begin.
- Communication: Being able to tell a clear, simple story with the data is far more valuable than any complex statistical model.
How Can a Small Business Start Without a Big Budget?
You don’t need to splash out on expensive software. The most powerful tool you have is probably the one you’re already using. Just start with spreadsheets. You can easily track essential metrics like employee turnover, time-to-hire, and absenteeism right there.
The trick is to focus on one or two problems that are having a real impact, like figuring out why new hires are leaving within their first year. By concentrating your efforts, you can show real value quickly without a big financial investment. Actionable first step: Pick one metric, like turnover rate. Track it monthly in a simple spreadsheet. After three months, you'll have a baseline to start asking "why?" This builds momentum and makes it much easier to argue for more advanced tools down the road.
The goal isn't to have the fanciest tools; it's to answer important questions. Start small, prove the value, and then scale your efforts.
What Are the Ethical Rules for Using Employee Data?
Handling employee data ethically isn't just a rule; it's non-negotiable. The bedrock principle here is transparency. Be completely open with your employees about what data you’re collecting, why you need it, and how it will be used to make the organisation better for everyone.
Here are three actionable rules to follow:
- Purpose Limitation: Only collect and analyse data to answer a specific, legitimate business question that benefits employees (e.g., improving fairness, offering better training).
- Data Minimisation: Collect only the data you absolutely need. Don't gather extra information "just in case."
- Anonymisation: Whenever possible, aggregate and anonymise data to focus on group trends rather than individual behaviour. This protects privacy and builds trust.
Always make sure you’re following data protection regulations like GDPR. The focus should always be on analysing systems and processes, not on monitoring individuals. Building that trust is absolutely fundamental to making any HR analytics programme work for the long haul.
Gain a clear, privacy-first view of how your teams work with WhatPulse. Our platform provides actionable insights into application usage and work patterns, helping you optimise resources and improve productivity without compromising employee trust. Learn how WhatPulse can transform your organisational understanding.
Start a free trial