
Trying to run a business by only looking at last month's revenue is a bit like driving a car while staring into the rearview mirror. You get a perfect, crystal-clear view of where you've been, but you have absolutely no idea what's coming up on the road ahead.
This is where understanding the difference between lead and lag indicators becomes a real game-changer. These aren't just fancy business terms; they are the tools that give you a complete picture of your company's health—both where it is and where it's going.
Think of it this way: lagging indicators are your rearview mirror, and leading indicators are your GPS, showing you the route ahead. You need both to navigate effectively. By balancing the two, you can stop reacting to the past and start proactively shaping the future.
Your Guide to Navigating Business Performance
The core idea is to connect the daily actions your team takes (the inputs) with the big-picture results you're aiming for (the outcomes). When you track both, you can finally see which activities are actually moving the needle. It's the difference between hoping you'll hit your quarterly target and knowing you're on the right track to do so.
To really get a feel for how they work together, it helps to see them side-by-side.
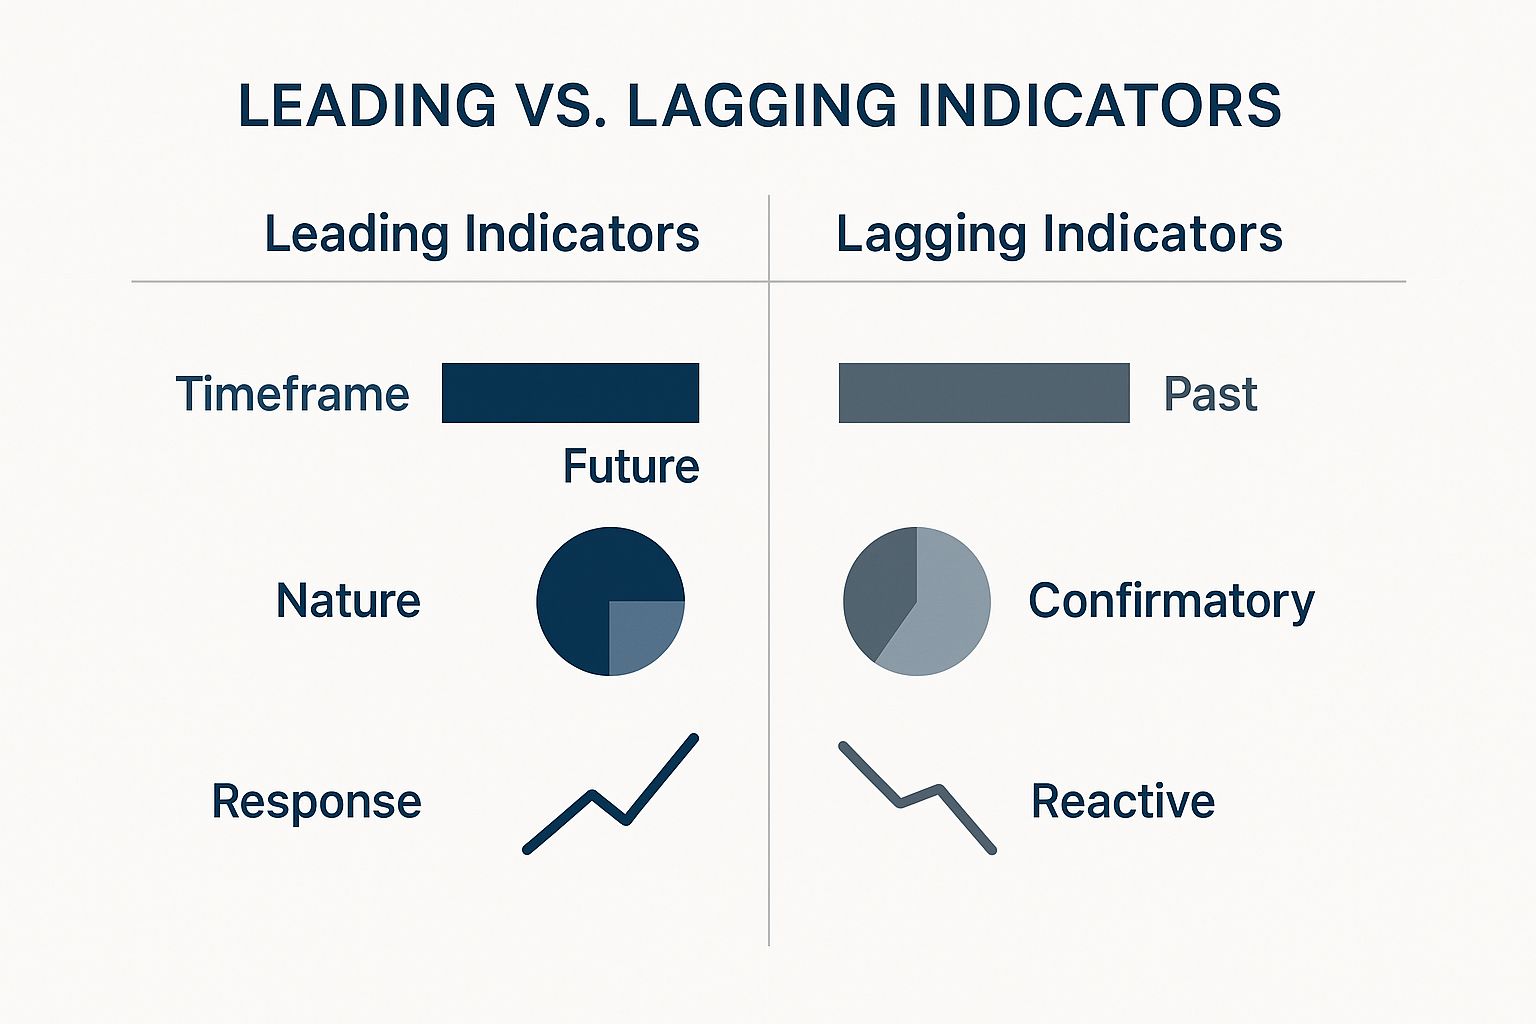
As the infographic highlights, leading indicators are all about prediction. They give you a heads-up, allowing you to make adjustments before it's too late. Lagging indicators, on the other hand, are about confirmation. They tell you if your strategy actually worked.
To make this even clearer, here's a quick table breaking down the key differences.
Leading vs Lagging Indicators At a Glance
| Characteristic | Leading Indicators (The Forecast) | Lagging Indicators (The History) |
|---|---|---|
| Purpose | Predictive; they forecast future outcomes. | Confirmatory; they measure past results. |
| Timing | Future-focused. | Past-focused. |
| Influence | You can directly influence them through daily actions. | You cannot change them; they've already happened. |
| Business Response | Enables proactive adjustments and course correction. | Triggers reactive analysis and strategic planning. |
| Example | Number of sales demos booked this week. | Total revenue generated last quarter. |
Ultimately, a business that only tracks lagging indicators is always playing catch-up. By combining the forecast (leading indicators) with the historical record (lagging indicators), you gain a powerful advantage.
You get the ability to not only measure past success but also to actively influence future results.
Mastering this balance helps you make smarter, faster decisions. It allows you to align your teams around the activities that have the highest impact and steer your organisation toward its goals with confidence, rather than just reacting to whatever the last quarter's report tells you.
Understanding Leading Indicators
Imagine you're driving a car at night. Your headlights are the leading indicators. They don't show you where you've been; they light up the road ahead, revealing bends, obstacles, and opportunities long before you reach them. In business, these are the predictive, forward-looking metrics that give you early signals of what's to come.
Their real power is that they are actionable. A good leading indicator gives you the time you need to prepare for growth or, just as importantly, to correct your course before a small issue snowballs into a major problem. You stop reacting to last quarter's results and start proactively managing the activities that will shape next quarter's success.
The Power of Predictive Metrics
The true value of a leading indicator is its direct link to a future result. It measures the inputs and the day-to-day activities that actually drive the outcomes you want. When you focus on these, you shift from just hoping for success to building a system that reliably produces it.
For example, a sudden surge in website visitors signing up for a product demo doesn't just feel good—it's a strong leading indicator that your sales revenue will likely increase next month. Why? Because demos are a direct input that leads to the outcome of closed deals.
The real strength of a leading indicator is its ability to turn data into a decision. It answers the question, "What can we do right now to improve our future results?"
By focusing on these predictive metrics, you give your teams a clear target. They can concentrate on the specific actions that have the biggest impact, aligning everyone's efforts toward a common, measurable goal. To do this right, you need to understand the difference between simply tracking vs measuring your data.

Practical Examples Across Departments
Leading indicators aren't just for the sales team; they're vital for every part of your organisation. The trick to finding the right ones is to work backward from your main goals (which are often lagging indicators) and identify the key activities that happen before those goals are met.
Here are a few concrete examples:
- Sales: Instead of only looking at last month's revenue, a sales team could track the New Sales Pipeline Value. A spike in the value of new opportunities entering the pipeline this week is a solid predictor of future closed deals.
- Marketing: A marketing team might track Content Engagement Rates on its key articles or downloads. High engagement suggests that both the quality and quantity of leads will improve, which will eventually impact sales.
- Customer Success: To get ahead of customer churn, a success team can monitor Product Adoption Rates. When users actively adopt new features, it's a powerful leading indicator of higher retention and future renewals.
Each of these metrics acts as an early warning system. If the pipeline value drops or product adoption stalls, you have a chance to intervene immediately, rather than waiting for the bad news to show up in a quarterly report. This proactive approach is the whole point of managing with lead lag indicators.
Understanding Lagging Indicators
If leading indicators are your car's headlights, lagging indicators are the rearview mirror. They don't tell you what's coming, but they give you a crystal-clear picture of where you've been and how you got there. These are the hard numbers, the final scores that confirm what has already happened.
Think of metrics like quarterly profit, customer lifetime value (LTV), or the employee turnover rate. You can't change last quarter's profit today—it's already in the books. Their power lies in validation. They prove whether your strategies actually delivered the goods and help you understand the "why" behind your performance.

This look back is essential for smart planning. For instance, a detailed study across 40 regions in the Netherlands found a significant delay—about two years—between major economic shifts and new industrial land development. That lag confirms a real-world connection between economic cause and effect. You can dig into the full economic-land use research to see how these dynamics play out over time.
The Value of a Historical View
It's tempting to write off lagging indicators as "too little, too late." That’s a common trap. In reality, they are what keep your strategy grounded and honest.
First off, they confirm if your forward-looking activities are working. You might have boosted your sales team's call volume (a leading indicator), but did that translate into higher quarterly revenue (a lagging indicator)? Without that lagging metric, you're just hoping for the best.
Second, lagging indicators are the language of accountability. Your board members and investors want to see concrete results like profit margins and market share, not just the busy work you did to get there.
Lagging indicators don't predict the future, but they provide the irrefutable evidence needed to learn from the past and build a more effective strategy for tomorrow.
Examples of Key Lagging Metrics
Lagging indicators pop up in every corner of a business, measuring the final outcomes. They tell the story of what your team has actually accomplished.
Here are a few classic examples of lead lag indicators, seen from the lagging perspective:
- Finance: Net Profit Margin. This is the ultimate bottom-line number. It tells you, without ambiguity, how profitable your operations were over a set period.
- Customer Success: Customer Churn Rate. This measures the percentage of customers you lost. It’s a clear, if sometimes painful, look back at customer loyalty.
- Operations: Revenue per Employee. By dividing total revenue by your headcount, you get a solid snapshot of past operational efficiency.
The real danger is trying to manage your business using only this rearview mirror. If you only react to past events, you'll always be one step behind what's coming next. The best approach is to balance this historical proof with predictive, forward-looking insights.
Combining Indicators for a Holistic View
Think about driving a car. You spend most of your time looking ahead through the windscreen, but you still need quick glances in the rearview mirror. Relying on just one gives you a dangerously incomplete picture of the road.
The same is true for your business strategy. Real insight only comes when you combine the forward-looking view of leading indicators with the backward-looking confirmation of lagging indicators.
A lagging indicator, like hitting £1 million in annual revenue, confirms you’ve reached your destination. It's solid proof. But it's the leading indicators, like generating 200 qualified leads per month, that tell you if you're on the right pace to get there. The real power lies in seeing how one directly influences the other.
This isn't a new idea; it even works at a national level. A deep analysis of the Dutch economy found its composite leading index consistently signalled economic turns about 2 months before they happened. In contrast, the lagging indicators only confirmed these shifts much later, trailing by a median of 11 to 13 months. It's the classic dynamic: you need forecasts to guide you and historical proof to validate your path.
Creating a Balanced Scorecard
To get a complete view, you need a simple framework that connects your daily actions to your ultimate outcomes. The best way to do this is to start with your end goal—your most important lagging indicator—and work your way backwards to identify the activities that get you there. This creates a clear cause-and-effect map that your teams can actually use.
Here’s a practical, step-by-step way to build this connection:
Define Your Primary Lagging Goal: Start with a big-picture strategic objective. Make it a clear, measurable outcome that defines success for a specific period.
- Actionable Step: Write down your top 1-2 lagging goals for the next quarter. Example: "Increase customer retention from 85% to 90%."
Identify Predictive Leading Activities: Now, brainstorm the actions and behaviours that directly push that lagging goal forward. What has to happen before a customer decides to stick around?
- Actionable Step: List at least five daily or weekly activities that influence your goal. Examples: "Resolve support tickets faster," "Increase new feature adoption," "Proactively contact at-risk accounts."
Select Actionable Leading Indicators: Turn those activities into specific, trackable metrics. These are the levers your team can pull day in and day out.
- Actionable Step: For each activity, define a clear metric. Examples: "Average support ticket resolution time (in hours)," "Percentage of users adopting Key Feature X within 30 days," "Number of proactive outreach calls made per week."
Following this process transforms a vague, distant goal into a set of clear, daily actions. It shifts the entire team's focus from just reporting on what happened last month to actively shaping what will happen next. Our guide on turning data into decisions digs deeper into making this a core part of your operations.
The most powerful strategies don't just measure outcomes; they build a clear and logical path from today's inputs to tomorrow's results. This alignment turns your data into a true navigational tool.
Validating Your Indicator Relationships
Once you’ve paired up your lead lag indicators, the last step is to make sure they're actually connected. You have to regularly check if your leading metrics are genuinely predicting your lagging outcomes.
Here’s a practical way to validate:
- Track both indicators over time: For 1-2 quarters, plot both your chosen leading indicator (e.g., website demo sign-ups) and your lagging indicator (e.g., new monthly revenue) on the same graph.
- Look for correlation: Do you see a pattern? Does a spike in demo sign-ups in one month consistently lead to a revenue increase the next?
- Adjust if needed: If you see no connection, your initial assumption might be wrong. That's not a failure; it's a signal to test a different leading indicator.
To get an even sharper picture, many businesses use more advanced analytics. You might explore sophisticated churn prediction models that blend different indicators to get a more accurate forecast of customer behaviour. This constant cycle of measuring, analysing, and refining is what keeps your strategy effective and pointed squarely at your most important goals.
How to Implement and Track Your KPIs
Choosing the right metrics is a great first step, but the real growth happens when you turn that raw data into decisive action. To successfully implement lead and lag indicators, you need a system that weaves tracking into your team’s daily routine, making data-driven decisions feel like second nature.
The heart of this system is a centralised KPI dashboard. Think of it less as a simple reporting tool and more as a single source of truth where both leading and lagging metrics are visible to everyone. This kind of transparency is powerful. It aligns teams by showing them exactly how their day-to-day activities (the leading indicators) directly fuel the big-picture company goals (the lagging ones). If you're looking for inspiration on how to visualise your own metrics, check out these 8 KPI dashboard examples.
Establishing a Regular Review Cadence
A dashboard only works if people actually look at it. The trick is to set up a review schedule that matches the pace of your indicators because different metrics need different levels of attention.
Here's a practical schedule to start with:
- Weekly Operational Check-ins (Leading Indicators): Dedicate 30 minutes every Monday morning for teams to review their leading indicators from the previous week. The agenda should be simple:
- Review the numbers (e.g., sales calls, leads generated).
- Discuss what went well and what didn't.
- Set a clear target for the current week.
- Monthly Strategic Reviews (Lagging Indicators): Hold a one-hour meeting on the first week of each month to review lagging indicators like revenue or customer churn. This is for leadership and team leads to:
- Confirm if the leading activities are driving results.
- Analyse trends over the past quarter.
- Make strategic decisions for the month ahead.
This dual cadence ensures you’re steering both the daily inputs and the long-term outcomes without getting bogged down in the wrong details at the wrong time.
Choosing the Right Tools and Systems
With a clear process mapped out, the final piece is picking the tools to make it all happen. Your tech stack should make tracking and reporting as seamless as possible.
Here’s a breakdown of options to help you choose:
- Simple Spreadsheets (Google Sheets, Excel): Perfect for small teams or when you’re just starting.
- Actionable Step: Create a simple sheet with columns for the date, the leading indicator (e.g., "Demos Booked"), and the team member responsible. Use built-in charts to visualise trends.
- BI Platforms (Tableau, Power BI): The best fit for larger organisations that need to pull data from many different sources (like your CRM, marketing automation, and finance software).
- Actionable Step: Start with a single dashboard connecting 2-3 key data sources to display one lagging goal and its three supporting leading indicators.
- Specialised Analytics Tools (WhatPulse): Platforms like WhatPulse can give you incredibly deep insights into specific operational areas, like application usage and work patterns, which are fantastic sources for leading indicators.
This isn’t just a business-level strategy; it's used at the national level, too. For instance, Statistics Netherlands uses its Business Cycle Tracer to monitor 15 different macroeconomic indicators. They group them into leading, coincident, and lagging categories to get an accurate, timely snapshot of the entire Dutch economy.
Ultimately, the goal is to build a sustainable system where data isn’t just collected but is actively used to inform strategy, align teams, and foster a culture of continuous improvement.
By creating a transparent dashboard, setting a consistent review cadence, and selecting the right tools, you transform your KPIs from static numbers on a page into a dynamic guide for your business. This level of clarity is vital, and you can see how to optimise work patterns with data transparency and WhatPulse to put it into practice.
Common Questions About Lead Lag Indicators
Even with a great strategy, practical questions always come up when teams first start using lead lag indicators. Getting clear on these points can make the whole process smoother and help everyone focus on what really matters: turning data into action.
Let's dig into some of the most common questions people ask when they put these metrics into practice.
How Many Indicators Should a Business Track?
There’s no magic number here. The biggest mistake you can make is trying to track too many things at once. The goal is clarity, not more complexity. A good rule of thumb is to pick 3-5 critical indicators for each major business goal.
Actionable Step: For your most important lagging goal (e.g., 'Increase Annual Revenue'), work with your team to select just three leading indicators you can influence daily or weekly. For revenue, these could be:
- Sales Pipeline Value: The total value of all your open opportunities.
- Number of Demos Booked: A direct measure of sales activity.
- Website Conversion Rate: The percentage of visitors taking a key action.
It’s always better to track a few meaningful metrics consistently than to get buried in a mountain of data you never use. Start small, prove the connection between your indicators, and then add more to your dashboard as you gain confidence.
Can a Metric Be Both a Leading and Lagging Indicator?
Absolutely. A metric’s role isn’t set in stone—it all comes down to context. The exact same KPI can be a leading indicator for one goal and a lagging indicator for another. This is what makes them so versatile.
Think about the Customer Satisfaction Score (CSAT).
- As a lagging indicator: When you review last month's CSAT report, it measures the past performance of your support team—a report card on what already happened.
- As a leading indicator: That same CSAT score is a powerful predictor of future Customer Churn. A high satisfaction score is a strong signal that customers will likely stick around, while a dipping score is an early warning that your renewal rates might be in trouble.
Actionable Step: Review your current KPIs and ask, "What does this metric predict for the future?" and "What past performance does this metric confirm?" This helps you see the dual nature of your data.
What Are the Most Common Mistakes to Avoid?
It's easy to fall into a few common traps when working with lead and lag indicators, even with the best intentions. Just being aware of them is the first step toward steering clear.
- Focusing only on lagging indicators: This creates a reactive culture where you're always analysing the past instead of shaping the future.
- How to Avoid: Ensure your team dashboards display at least two leading indicators for every one lagging indicator.
- Choosing "vanity metrics": These are leading indicators that look great but don't actually predict the outcomes you care about (e.g., social media likes that don't convert to leads).
- How to Avoid: Always ask, "If this leading metric goes up, can we prove that our lagging goal will also improve?" If the answer is no, find a better metric.
- Not acting on the data: Your indicators are useless unless they drive conversations and decisions.
- How to Avoid: Make your review meetings action-oriented. End every meeting by asking, "Based on this data, what are we going to do differently this week?"
How Often Should We Review Our Indicators?
The right review cadence depends on the metric's speed and purpose. A one-size-fits-all approach just doesn't work here, because different indicators tell their stories on different timelines.
Actionable Step: Set up your review schedule based on how quickly a metric can change and how fast you can react.
- Leading Indicators (e.g., sales calls, website traffic): Review daily or weekly. These metrics track real-time activities and allow for immediate course correction. Use a short, 15-minute daily huddle or a weekly team sync.
- Lagging Indicators (e.g., quarterly profit, customer churn rate): Review monthly or quarterly. These outcomes take longer to develop. Use these for deeper strategic discussions during monthly business reviews.
Setting up this kind of rhythm ensures you always have a steady pulse on your business’s health and direction.
Ready to get a clear, privacy-first view of how work actually gets done in your organisation? WhatPulse provides the actionable data you need to identify powerful leading indicators, from application usage to focus time. See how you can optimise your team's performance by visiting https://whatpulse.pro.
Start a free trial