

Earned value management gives you a single, unified view of your project's cost, schedule, and scope. It goes way beyond just comparing your budget to what you’ve spent. Instead, it measures the real work you’ve accomplished against your plan, giving you an honest, objective look at your project's health. Think of it as an early warning system that helps you spot trouble long before it becomes a crisis.
What Is Earned Value Management
Let’s imagine you're planning a road trip from Amsterdam to Paris. You've budgeted €300 for the trip and figured it'll take six hours.
Three hours in, you check your wallet and see you've already spent €200. Are you on track? A simple budget check says you’ve burned through two-thirds of your money but are only halfway through your planned time. That feels off, but you're missing a key piece of the puzzle: how far have you actually driven?
This is exactly the problem that Earned Value Management (EVM) is designed to solve. It’s a project management technique that ties together your scope, schedule, and resources to paint a complete performance picture. Rather than looking at cost and schedule as separate things, EVM combines them to answer the one question that really matters: are we getting the value we planned for the money and time we've spent?
The Three Pillars of EVM
At its core, EVM is built on three fundamental data points. Get your head around these, and you’re well on your way to mastering the methodology.
- Planned Value (PV): This is your baseline. It's the authorised budget for the work you've scheduled to complete by a certain point. In our road trip analogy, at the three-hour mark, your PV is €150—half the budget for what should have been half the trip.
- Actual Cost (AC): This one's straightforward. It's the total amount of money you've actually spent to get the work done. In our example, that's the €200 you’ve spent so far.
- Earned Value (EV): This is the heart and soul of EVM. It measures the value of the work you've actually completed, priced according to your original budget. If you've actually driven two-thirds of the way to Paris (not just halfway), your EV is two-thirds of the total budget, or €200.
This simple concept map shows how the money flows from the initial plan to the final cost.
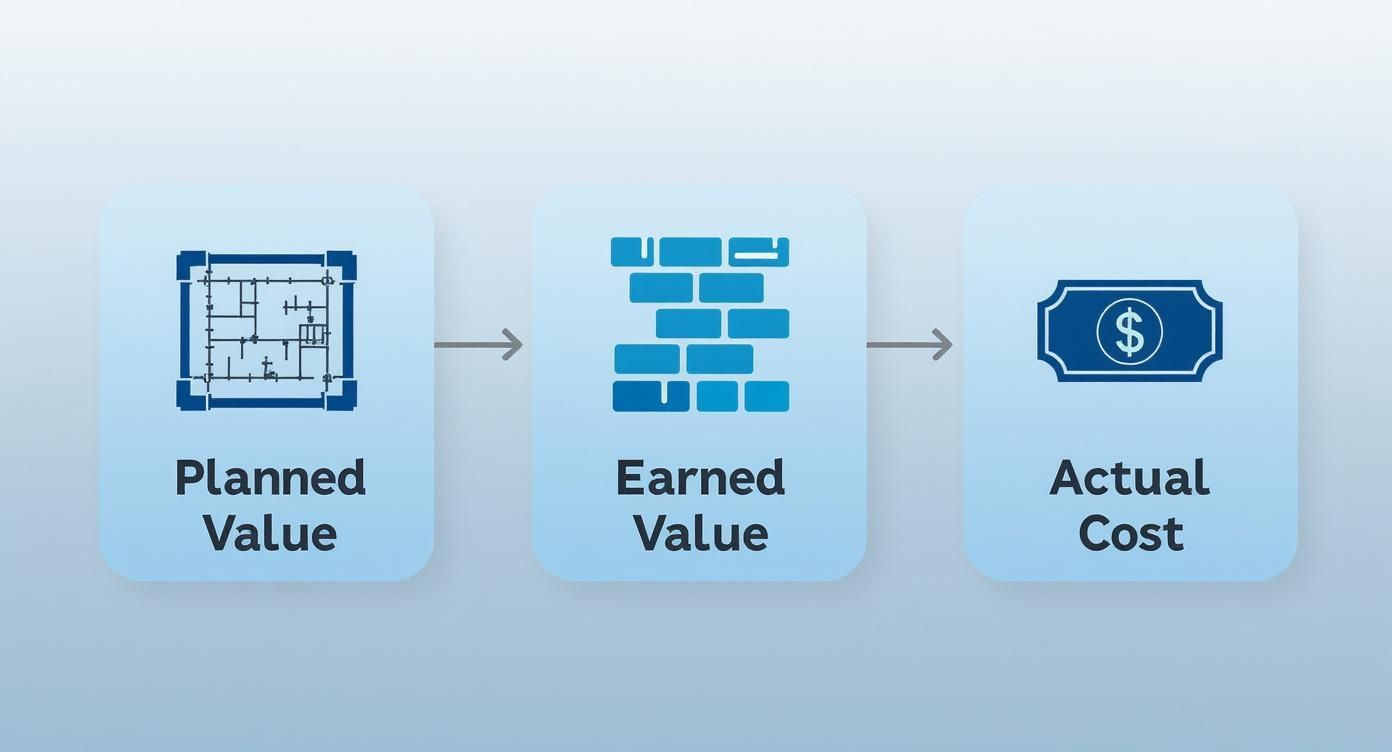
As the visual shows, Planned Value is the blueprint. Earned Value measures the bricks you've actually laid, and Actual Cost tracks how much you paid for them.
EVM is gaining a lot of traction for a reason. Here in the Netherlands, its adoption in large-scale projects is significant. Around 68% of major Dutch construction projects now use EVM, which is quite a bit higher than the European average of about 52%.
By comparing your EV (€200) to your PV (€150), you can see you're ahead of schedule. And by comparing your EV (€200) to your AC (€200), you realise you're perfectly on budget for the progress you've made. All of a sudden, that initial worry is gone, replaced by a much clearer—and more positive—picture.
While Earned Value Management provides powerful insights, it's always smart to weigh your options when choosing the right project management methodology for your specific needs. The structured approach of EVM delivers a robust framework for control, forecasting, and keeping your stakeholders clearly in the loop.
Understanding the Core EVM Formulas
Once you’ve got a handle on the three pillars—Planned Value (PV), Earned Value (EV), and Actual Cost (AC)—you can tap into the real diagnostic power of EVM. The magic isn’t just in tracking these numbers; it's about using a few simple formulas to compare them. This is how raw data becomes a clear signal about your project's health.
These formulas aren't complicated, but they are incredibly insightful. They help you answer two critical questions at any point in your project: Are we on schedule? And are we on budget?

Let's pull back the curtain on the core calculations you'll be using. We’ll use a simple project to keep things grounded: building a small backyard deck.
Project Scenario: The Backyard Deck
- Total Budget: €4,000
- Planned Duration: 4 weeks
- Our Check-in: End of Week 2
At the end of the second week, you take stock. The plan said you should have 50% of the work done by now. But after a quick assessment, you see only 40% of the deck is actually built. And looking at the receipts, you’ve already spent €2,200.
With this info, we can lock in our three core metrics:
- Planned Value (PV): 50% of €4,000 = €2,000
- Earned Value (EV): 40% of €4,000 = €1,600
- Actual Cost (AC): €2,200
Now we have what we need to calculate our performance.
Calculating Project Variances
Variances are your first red flag. They tell you the size of the gap between your plan and reality, always expressed in monetary terms. Think of it this way: a positive number is good news (you’re ahead!), while a negative number means it's time to pay attention.
Schedule Variance (SV) This formula tells you, in financial terms, if you're ahead of or behind schedule. It compares the value of the work you've actually finished (EV) against what you planned to have finished (PV).
- Formula: SV = EV - PV
- Our Example: SV = €1,600 - €2,000 = -€400
That -€400 is a clear sign you’re behind schedule. You’ve completed €400 less work than you were supposed to by this point. The actionable step here is to investigate why. Are tasks taking longer than estimated? Was a key resource unavailable?
Cost Variance (CV) This is your most direct look at budget health. It compares the value of the work you've done (EV) to what you actually paid for it (AC). It answers the simple question: "Did we get our money's worth?"
- Formula: CV = EV - AC
- Our Example: CV = €1,600 - €2,200 = -€600
A negative CV of -€600 means you are over budget. For the work you’ve gotten done, you've spent €600 more than you should have. It's a direct hit to your bottom line. Now you need to determine the cause: did material costs rise unexpectedly, or is the team spending more hours than planned?
Measuring Project Efficiency With Indices
Variances give you the raw numbers, but indices give you a ratio. They measure your efficiency and are fantastic for tracking performance over time. Are you getting better or worse at using your time and money? The indices will tell you.
Schedule Performance Index (SPI) The SPI turns your schedule variance into an efficiency score. It's a great way to gauge your team's momentum and productivity.
- Formula: SPI = EV / PV
- Our Example: SPI = €1,600 / €2,000 = 0.80
Any SPI below 1.0 means you're behind. An SPI of 0.80 tells you that you're only progressing at 80% of the speed you planned. Your action plan could involve reallocating resources to critical tasks or simplifying upcoming work to catch up.
Cost Performance Index (CPI) The CPI is arguably the most important metric in the whole EVM toolkit. It measures cost efficiency, showing exactly how much value you’re generating for every single euro you spend.
- Formula: CPI = EV / AC
- Our Example: CPI = €1,600 / €2,200 = 0.73
A CPI below 1.0 means you're burning through cash too quickly. A CPI of 0.73 is a major warning. It means that for every euro you spend, you are only getting €0.73 worth of work in return. This requires immediate action, such as reviewing vendor costs, optimizing team processes, or seeking scope reductions.
Here's a quick reference table to keep these straight.
EVM Core Metrics at a Glance
This table summarises the fundamental metrics in Earned Value Management, their formulas, and what each one tells you about project health.
| Metric (Abbreviation) | Formula | What It Measures |
|---|---|---|
| Schedule Variance (SV) | EV - PV | The monetary value of being ahead of or behind schedule. |
| Cost Variance (CV) | EV - AC | The monetary value of being under or over budget. |
| Schedule Performance Index (SPI) | EV / PV | The efficiency rate of your progress against the schedule. |
| Cost Performance Index (CPI) | EV / AC | The efficiency rate of your spending against the budget. |
Think of these as the dashboard gauges for your project—each one gives you a vital reading at a glance.
These metrics—variances and indices—are the foundation of proactive project management. They don't just tell you that there's a problem; they quantify it, allowing you to analyse trends, forecast future performance, and take corrective action before it's too late.
Grasping the difference between these metrics is vital. If you're interested in a deeper look at performance measurement, our guide on the differences between lagging and leading indicators offers more context on using data for smart forecasting. In EVM, metrics like CPI and SPI act as powerful lagging indicators, revealing the true health of your project based on what's already happened.
Putting Earned Value Management into Practice
Knowing the formulas is one thing, but applying them is where earned value management really comes alive. Let's step away from the theory and walk through a concrete example. This is how you turn a bunch of numbers into a clear story about your project's health.
Imagine we're running a small digital marketing campaign with a clear scope and timeline.
Project Scenario: "Alpha Launch" Marketing Campaign
- Total Budget (BAC): €10,000
- Timeline: 4 weeks
- Deliverables: The work is split into four main chunks, one for each week.
- Week 1: Develop ad creatives and copy.
- Week 2: Build and configure landing pages.
- Week 3: Set up and launch social media and search ads.
- Week 4: Monitor, analyse, and deliver the final performance report.
This simple breakdown is a basic form of a Work Breakdown Structure (WBS), which is the backbone of any good EVM setup. To see how this works on bigger projects, you can check out these work breakdown structure examples for project management.
We’ve hit our first checkpoint at the end of Week 2. Time to see where we really stand.
Gathering the Core Data at Week 2
First, we need our three key pieces of information: what we planned to do, what we actually did, and what we spent.
The plan was simple: by the end of Week 2, we should have finished the first two deliverables (creatives and landing pages). That represents 50% of the total project.
But reality tells a different story. A quick review shows the ad creatives are done (that's 25% of the project), but the landing pages are only half-finished (another 12.5%). All told, we've only completed 37.5% of the total work.
Finally, a look at the books shows we've spent €4,500 so far.
Now we can calculate our core EVM inputs:
- Planned Value (PV): 50% of €10,000 = €5,000
- Earned Value (EV): 37.5% of €10,000 = €3,750
- Actual Cost (AC): €4,500
With these three numbers, we have everything we need to diagnose the health of our campaign.
Diagnosing Performance with Variances and Indices
Let's plug our data into the formulas and see what they tell us.
Schedule Variance (SV = EV - PV): €3,750 - €5,000 = -€1,250. The negative number is an instant red flag. We’re behind schedule. We've delivered €1,250 less work than we planned to by this point.
Cost Variance (CV = EV - AC): €3,750 - €4,500 = -€750. Another negative, which means we’re over budget. The work we've managed to complete has cost us €750 more than it should have.
Schedule Performance Index (SPI = EV / PV): €3,750 / €5,000 = 0.75. An SPI of 0.75 means we’re working at only 75% of the speed we planned. For every hour of progress we expected, we're only getting 45 minutes worth.
Cost Performance Index (CPI = EV / AC): €3,750 / €4,500 = 0.83. A CPI of 0.83 is a major concern. It tells us that for every single euro we spend, we are only generating €0.83 of actual value.
The practical application of EVM is key to effective project financial management, offering detailed insights into cost and schedule performance. For those looking to broaden their understanding of this area, resources on Mastering Project Financial Management can provide additional valuable context.
Forecasting the Project's Future
The real power of EVM isn't just in diagnosing the past; it's about predicting the future. Based on how we're performing now, where is this project headed?
The most common assumption in EVM forecasting is that the performance to date (as measured by CPI) will continue for the rest of the project. This gives us a realistic, data-driven glimpse into the future.
Estimate at Completion (EAC) This formula predicts the most likely total cost if our current spending efficiency continues.
- Formula: EAC = BAC / CPI
- Our Example: EAC = €10,000 / 0.83 = €12,048
The forecast is clear: this project is on track to cost over €12,000, a serious overrun from our original €10,000 budget.
Variance at Completion (VAC) This tells us exactly how much over or under budget we're likely to be at the end.
- Formula: VAC = BAC - EAC
- Our Example: VAC = €10,000 - €12,048 = -€2,048
The VAC predicts that if we don't change course, we'll finish the project €2,048 in the red.
Armed with this hard evidence, we can now make smart decisions. Do we need to find ways to work more efficiently? Should we talk to the stakeholder about adjusting the scope? Or do we simply need to reset expectations about the final budget? This is the kind of proactive control that makes earned value management an essential tool for any project manager.
How to Visualise Performance with S-Curves
While the formulas give you the hard numbers, a picture tells the story much faster. That’s where the S-curve comes in. It’s a powerful graph that plots your key EVM metrics over time, turning a spreadsheet full of data into an intuitive, at-a-glance dashboard.
An S-curve gets its name from the typical shape of project costs over their lifecycle. Things start slow, ramp up during the busiest phase, and then level off as the work wraps up. When you plot Planned Value (PV), Earned Value (EV), and Actual Cost (AC) on the same graph, you create a visual narrative that even stakeholders outside the project team can understand instantly.
This chart shows a classic EVM scenario, with the three core S-curves mapped against the project timeline. Those gaps between the lines aren’t just empty space; they are the cost and schedule variances we calculated earlier. Performance issues become impossible to ignore.
Reading the Story of the Curves
The real beauty of the S-curve is its simplicity. The position of the three lines relative to each other tells you everything you need to know about your project’s health at any moment.
It all comes down to comparing your Earned Value (EV) curve to the other two:
- EV vs. PV (Schedule): If your EV curve is below the PV curve, you’re behind schedule. The horizontal distance between the two lines shows you just how far behind you’ve slipped in terms of time.
- EV vs. AC (Cost): If your EV curve dips below the AC curve, you’re over budget. The vertical gap between them represents the exact monetary value of that cost overrun.
This one visual transforms a lot of complex EVM data into a straightforward performance story.
An S-curve is more than a chart; it's a diagnostic tool. A widening gap between curves is a red flag that a problem is getting worse, prompting you to dig deeper. A narrowing gap, on the other hand, shows that your corrective actions are actually working.
Common S-Curve Scenarios
Once you get used to them, you can diagnose project health just by recognising a few classic S-curve patterns. Each one paints a distinct picture, allowing for quick assessment and clear communication with your team.
Here are four common scenarios you’ll run into:
- The Ideal Project: All three curves—PV, EV, and AC—are tracking closely together. This means you’re on schedule and on budget. It’s rare, but it’s the goal we all aim for.
- Behind Schedule & Over Budget: The EV curve is below both the PV and AC curves. This is the classic "troubled project" snapshot, showing you’re losing on both time and money. Your action is to conduct a root cause analysis immediately.
- Ahead of Schedule but Over Budget: Your EV curve is above PV (good!) but below AC (bad!). Your team is moving fast, but they’re burning through cash to do it. The practical step is to analyze if the increased speed is worth the cost. Is it sustainable?
- Behind Schedule but Under Budget: The EV curve is below PV (bad!) but above AC (good!). Progress is slow, but at least you’re spending less than planned for the work you’ve managed to complete. Action item: Investigate if the budget can be used to accelerate the schedule (e.g., by adding resources).
Visualising your project with S-curves is a fundamental part of good reporting. But to build these charts, you need a solid foundation. That starts with a well-structured plan, and you can get a head start by using a reliable project planning template for Excel to make sure your baseline data is set up correctly from day one.
Bringing EVM Into Your Organisation
Knowing what Earned Value Management is and actually using it are two different things. Getting EVM running in your organisation isn't about memorising formulas; it’s about setting up a solid foundation of processes, clear roles, and data you can actually trust. Here’s a practical blueprint for making EVM a core part of how you deliver projects.
The first step is building the structure that EVM needs to work. If you skip this, your calculations will be built on shaky ground, giving you numbers that look official but don't reflect reality.
Laying the Groundwork for Success
Before you can calculate your first variance, you need a plan that everyone on the team understands and agrees with. This is the bedrock of your whole EVM system.
Develop a Detailed Work Breakdown Structure (WBS): This is non-negotiable. The WBS breaks down the entire project scope into smaller, more manageable chunks called work packages. Actionable Step: For each work package, define a clear "definition of done" so there's no ambiguity about when it's complete.
Establish the Performance Measurement Baseline (PMB): Think of the PMB as the official plan that everything else gets measured against. It combines your scope (from the WBS), your schedule, and your budget into one time-phased plan. This baseline becomes your "Planned Value" curve, and it must be kept stable and only changed through a formal process. Actionable Step: "Freeze" your PMB before work begins and implement a simple change request form for any proposed modifications.
With a solid WBS and PMB, you've clearly defined what needs to be done and set the benchmark for measuring its progress over time.
Establishing Clear Governance and Roles
EVM is a team sport. Everyone needs to know the rules of the game and their position on the field. Good governance makes sure everything is consistent and people are accountable for their part of the project.
Define Control Accounts: A control account is a specific point where you bring scope, budget, actual cost, and schedule together to measure performance. You assign a single manager, the Control Account Manager (CAM), to be responsible for each one.
Clarify Roles and Responsibilities: The CAM is a critical role. They own the performance of their control account—from planning and reporting to analysing why things are off track and figuring out how to fix them. Actionable Step: Create a one-page document for CAMs outlining their specific duties: reviewing actual costs, updating progress, and explaining variances in the monthly report.
Set a Reporting Cadence: Decide how often you'll report—weekly, bi-weekly, or monthly—and stick to it. This regular rhythm ensures that performance data is collected, analysed, and acted on quickly, so there are no nasty surprises at the end of the project.
Effective implementation is less about fancy software and more about disciplined processes. A well-defined governance structure ensures that everyone, from the project team to senior leadership, is speaking the same language when it comes to performance.
Ensuring Data Integrity and Accuracy
Your EVM system is only as good as the data you feed it. Inaccurate or late data is the fastest way to lose credibility with stakeholders and make your performance metrics useless. The Actual Cost (AC) is often the trickiest metric to get right, especially when it comes to labour.
This is where the quality of your data sources really matters. For example, a 2022 study by the Dutch Construction Industry Federation found that projects using EVM hit an average Cost Performance Index (CPI) of 1.08, meaning they were highly cost-efficient. In contrast, projects without EVM had a CPI of 0.92, showing they were consistently over budget. That gap often comes down to poor cost tracking. You can read more about the EVM adoption in the Dutch construction industry to see the full impact.
To make your data more reliable, focus on two key areas:
Accurate Time Tracking: Traditional timesheets are often based on memory and guesswork. Systems that automatically capture application usage and keyboard/mouse activity give you a far more objective measure of the time someone spends on a specific project task.
Integrated Cost Systems: Your project management tool and your accounting system need to talk to each other. Actionable Step: Set up a weekly sync between your accounting software and project management tool to import actual costs, ensuring your data is never more than a few days out of date.
By using modern data sources like endpoint telemetry, you can capture the "Actual Cost" of labour with much greater precision. This gives you an objective, granular look at where effort is actually being spent, leading to more trustworthy EVM calculations and forecasts that reflect reality, not just rough estimates. This move from manual entry to automated data capture is a huge step in maturing your earned value management capabilities.
Common EVM Pitfalls and How to Avoid Them
Adopting Earned Value Management brings incredible clarity, but getting it right means navigating a few common roadblocks first. If you know what to look for ahead of time, you can build a system that’s trustworthy from the start.
One of the most frequent problems is a shaky Performance Measurement Baseline (PMB). When scope creep runs wild, the baseline you’re measuring against is constantly shifting, which makes your performance data pretty much meaningless. The fix is a solid, formal change control process. Every single proposed change needs to be assessed for its impact on cost and schedule before it gets the green light.
Ensuring Data Accuracy and Buy-In
Another major pitfall is running your EVM system on inaccurate or late data. Your reports are only as good as the numbers you feed them, and if you’re waiting for accounting to finalise invoices, you’re managing the project with a view from the past.
To get around this, you need to integrate your project management and financial software so information flows smoothly. For labour costs, use accruals or estimated actuals to reflect work as it’s happening, rather than waiting weeks for timesheets to be processed. This keeps your Actual Cost (AC) in sync with your real-time performance.
Organisational resistance can also quietly sabotage an EVM implementation. If teams see it as just another layer of administrative burden rather than a helpful tool, they will not engage with the process properly.
The best way to counter this is by showing them the value, quickly. Start with a pilot project—something smaller and more contained. Actionable Step: Choose a 3-month project with a clear budget and scope. Run EVM in parallel with your existing reporting. At the end, present the EVM forecasts alongside the actual outcomes to demonstrate its predictive power. When you can point to a chart and show exactly how EVM helped forecast an overrun or get a struggling project back on schedule, you create powerful advocates.
This isn't just theory; it works in massive, real-world applications. In the Netherlands, a 2020 audit of major public infrastructure projects showed that those using EVM had an average cost overrun of only 9.4%, a massive improvement over the 18.7% for projects that didn't use it. You can find more details on the impact of EVM on Dutch public projects.
By getting ahead of these common issues, you can make sure your earned value system becomes a source of truth, not a source of frustration.
Common Questions About Earned Value Management
Even when you've got a handle on the basics, real-world projects throw curveballs. Applying a framework like Earned Value Management often brings up a few practical questions. Let's tackle some of the most common ones so you can adapt EVM to fit your team without getting tangled up in the theory.
How Can EVM Be Used in Agile Projects?
It's a common myth that EVM and Agile don't mix, but they absolutely can with a few small shifts in thinking. The key is to stop thinking about a single, massive upfront plan and start aligning EVM with your sprints.
Instead of measuring against a Gantt chart, use story points as your unit of value. The total story points planned for a sprint become your Planned Value (PV), and the points from completed stories at the end of the sprint become your Earned Value (EV). Actionable Step: At the end of each sprint, calculate the CPI using the sprint budget as your Actual Cost. A CPI below 1.0 indicates your sprint cost more than planned per story point, helping you adjust estimates for future sprints.
Is EVM Only for Large and Complex Projects?
Not at all. While EVM got its start on massive government and defence programmes, its principles are surprisingly scalable. The core idea—objectively comparing the value of work done to your plan and your spending—is just as useful for a €10,000 project as it is for a €10 million one.
For smaller projects, you don't need all the heavyweight process. Actionable Step: Use a simplified spreadsheet to track PV, EV, and AC on a weekly basis. Focus only on the top-level CPI and SPI. If these two metrics stay above 0.95, you know the project is healthy without needing detailed variance reports. This gives you 80% of the benefit with 20% of the effort.
How Is Progress Measured for Partially Completed Tasks?
This is a classic project management puzzle. If a task is halfway done, how much credit do you give it? The answer is to pick a consistent rule and stick with it. It’s less about being perfectly accurate for every single task and more about being consistent across the board.
Here are a few standard methods:
- The 0/100 Rule: Simple and brutal. A task is worth 0% until it is 100% finished. This is perfect for short, clear-cut tasks where "half-done" doesn't really mean anything.
- The 50/50 Rule: A good middle ground. A task gets 50% of its value the moment it starts and the final 50% when it's complete. This acknowledges that work is underway without getting bogged down in tiny percentage updates.
Actionable Step: Document your chosen method (e.g., "This project will use the 50/50 rule for all tasks longer than one week") in your project charter. This prevents debates later and ensures everyone measures progress the same way. Whichever method you choose, apply it uniformly. Consistency is what makes your EVM data reliable and trustworthy.
Gain privacy-first visibility into how work actually gets done across your organisation with WhatPulse. Turn real usage data into actionable decisions about software adoption, resource allocation, and team productivity. Learn how WhatPulse Professional can improve your project outcomes.
Start a free trial