

It’s a common mix-up, but the distinction is simple. Lead time is the entire clock, from the moment a customer makes a request until they have the finished product. Cycle time is a smaller piece of that clock—it only starts when your team actively begins working on the request.
Lead time is what your customer experiences. Cycle time is what your team executes.
Defining the Core Metrics: Lead Time and Cycle Time
Imagine you order a custom-built PC. The lead time starts the second you click "buy." It covers the time your order sits in the queue, the wait for a specific graphics card to come in stock, the actual assembly and software installation, and finally, the shipping and delivery. The whole journey.
The cycle time, on the other hand, begins when a technician picks up the case and starts building. It stops the moment the PC is assembled, tested, and boxed up for the courier. All the waiting around before and after the hands-on work is part of the lead time, but not the cycle time.
This difference is where you find hidden bottlenecks. A massive lead time paired with a tiny cycle time is a red flag. It tells you that tasks are spending far more time sitting in a queue than being worked on.
Lead Time vs Cycle Time at a Glance
The table below gives you a quick side-by-side comparison.
This helps frame how lead time gives you the customer's perspective, while cycle time zooms in on your team's production efficiency. Getting this right is a fundamental step toward establishing baseline metrics for continuous improvement.
| Aspect | Lead Time | Cycle Time |
|---|---|---|
| Perspective | Customer-focused (the entire waiting experience) | Production-focused (the active work period) |
| Start Point | When a request or order is made | When active work on the request begins |
| End Point | When the request is delivered to the customer | When active work on the request is completed |
| What It Measures | The entire process duration, including all wait times | The time spent actively producing or resolving a task |
| Primary Goal | To understand and improve the customer's total wait time | To understand and improve the efficiency of the work itself |
This table shows why you need to track both. Focusing only on one gives you an incomplete picture of your team's performance and its impact on the customer.
The simple truth is that customers don't care about your cycle time. They only experience lead time. Your internal efficiency gains are meaningless if the final delivery is still slow.
This isn't just a modern software development concept; it's a principle in lean manufacturing and business analysis, especially within Dutch frameworks. There, the distinction is clear. Lead time represents the full customer journey, delays and all. Cycle time, conversely, isolates the focused production phase from any queueing or logistical hold-ups.
Separating lead time from cycle time lets you see two different stories about your workflow. One story is about your customer's perception of your speed. The other is about your team's actual, hands-on efficiency. You need to understand both to make meaningful improvements.
Calculating and Visualizing the Difference
Definitions are one thing; measuring these metrics in your own workflow provides the real insights. The formulas themselves are straightforward, but they tell two different stories about your process. Using these calculations is the first step to pinpointing exactly where things slow down.
Lead time gives you the full customer-eye view. It captures the entire journey of a request, including all the dead time where a task is just sitting in a queue, waiting.
- Lead Time Formula: Delivery Date/Time – Request Date/Time
This calculation measures every moment from the initial ask to the final delivery. It’s simple, but it’s powerful because it includes not just the active work time but also all the waiting in between.
Isolating the Active Work Phase
Cycle time zooms in on the period when your team is actually hands-on with the work. It cuts out the time a task spends waiting in a backlog, focusing only on how long it takes to get the job done once it’s started. This gives you a much cleaner picture of your team’s production efficiency.
- Cycle Time Formula: Work End Date/Time – Work Start Date/Time
Think about a software development ticket. The lead time starts the second a user submits a bug report. From that moment, the clock is ticking from the user's perspective. The cycle time, however, doesn't begin until a developer assigns the ticket to themselves and drags it into an ‘In Progress’ column. Both timers stop once the fix is deployed.
The gap between these two numbers is pure wait time. A long lead time paired with a short cycle time is a clue. It tells you the bottleneck isn't your team's speed; it's the delays that happen before work even begins. You might have a bloated backlog, fuzzy priorities, or sluggish handoffs between teams.
Cycle time will always be a subset of lead time. If it isn't, something is wrong with how you've defined your process stages. That gap between the two is where you'll find your biggest opportunities for improvement.
This flowchart breaks down the process visually, showing exactly where lead time and cycle time start and stop.
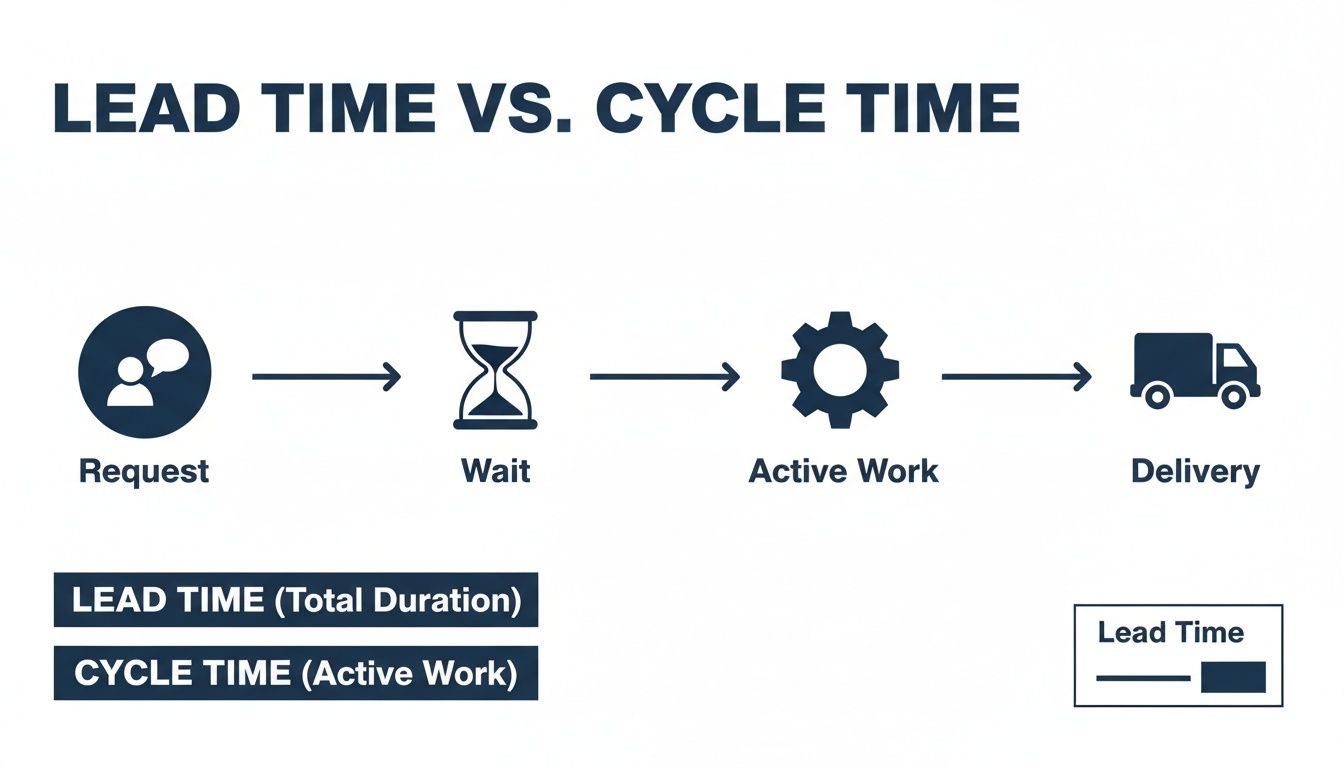
The chart separates the total customer wait (lead time) from the team's active work (cycle time), identifying the "wait" phase as the key difference.
Turning Data into Clear Visuals
Once you start calculating these metrics, you need to visualize them. Raw numbers in a spreadsheet are fine for analysis, but charts and graphs make trends and bottlenecks obvious. A Cumulative Flow Diagram (CFD) is a classic tool for this, showing how work piles up or flows through the different stages of your process over time.
Control charts are another option. They plot the lead and cycle times for individual tasks, letting you see the average and instantly spot outliers—those few tasks that took way longer than everything else. Those outliers often contain valuable process lessons.
To make sure your charts help, follow effective data visualization practices. Clear visuals prevent misinterpretation and get the whole team focused on solving the right problems. Your goal is a dashboard that tells a clear story about your workflow's health. For teams wanting to dig deeper, knowing how to approach exporting data from your dashboard is key for analysis in other business intelligence tools.
How These Metrics Look in the Real World
Definitions on a page only get you so far. The concept of lead time versus cycle time clicks when you see how they play out in practice. The context of your work—whether software development, IT tickets, or physical goods—changes where delays hide and where you can find the biggest wins.

Let's review a few scenarios. Each one shows where value gets stuck and how these two metrics expose different kinds of waste.
Example in Software Development
In software, lead time tracks a feature request from the second it’s logged in a tool like Jira until it’s live in production. This is the entire wait time as the stakeholder sees it. A product manager might see a lead time of 60 days and ask why development is so slow.
But the cycle time for that same feature might only be seven days. This is the actual time a developer was writing code, testing, and merging. That 53-day gap between the two metrics points straight to a process problem, not a coding problem. The feature sat in the backlog for weeks before anyone looked at it.
This is a classic situation that shows queueing as the real bottleneck. When lead times are high but cycle times are low, you’re often looking at:
- An unmanaged or poorly prioritized backlog.
- A team that doesn’t have the capacity to handle incoming requests.
- Slow handoffs between product, design, and development.
The team isn't slow; the system they’re working in is clogged.
Example in IT Operations
Think about an IT help desk. A user’s laptop dies, and they submit a support ticket. The lead time starts the moment they hit "submit" and only ends when a fully functional laptop is back in their hands. This could take days, leaving the employee unable to work.
Meanwhile, the cycle time for the IT technician might be just 45 minutes. That’s the time they spent diagnosing the problem, replacing a faulty hard drive, and re-imaging the machine. The rest of the lead time was waste—the ticket sitting in an unassigned queue or waiting for a spare part to be delivered.
For the user, the problem took days to solve. For the IT department, the "work" took less than an hour. This gap is the difference between customer satisfaction and operational efficiency, showing precisely why both lead time and cycle time must be tracked.
By focusing on that gap, an IT manager can start asking better questions. Is our ticketing system inefficient? Do we have a parts shortage? Is the team understaffed? These are the questions that lead to real process improvements and cut down on user downtime.
Example in Endpoint Management
Deploying a new laptop for a new hire is another example. The lead time kicks off the moment HR officially requests the device. It covers procurement, shipping, unboxing, configuration, and final delivery to the new employee on their first day.
The cycle time is much tighter. It might only cover the active technical setup: installing company software, configuring security settings, and joining the device to the network. This part could take just a few hours.
If the lead time is two weeks but the cycle time is three hours, the inefficiency has nothing to do with the IT team’s technical skills. The delay is buried in slow approval chains, procurement backlogs, or weak coordination between HR and IT. To shorten the lead time, you need to fix the administrative and logistical process, not rush the technical setup.
Example in Logistics and Shipping
Logistics is a classic home for these metrics. A customer’s order lead time covers the entire journey from their online purchase to the package landing on their doorstep. But the cycle time might only measure the few hours spent inside the warehouse picking, packing, and labeling the order for dispatch.
This distinction is well-understood in major logistics hubs. In the Netherlands, for instance, studies show an average export lead time of around 7 days between 2005 and 2014. That number includes everything from order processing to customs clearance for international customers. You can see more on how Dutch supply chains are optimized by exploring the data on CEIC.
For a logistics company, a long lead time with a short warehouse cycle time points to external delays. These could be problems with shipping carriers, hold-ups at customs, or inefficient order batching. The focus for improvement shifts from making warehouse staff pack faster to optimizing the entire supply chain.
Tools and Methods for Accurate Measurement
To get value out of these metrics, you must measure them consistently. It starts with your team agreeing on the exact start and end points for both lead time and cycle time. If those definitions are fuzzy, you'll end up with meaningless numbers.
Once you have that clarity, you can start gathering data. The trick is to build a simple system that gives you a clear signal about your process's health without burying everyone in administrative work.
Define Your Workflow Stages
First, map out your actual process. What are the steps a task goes through from the moment it's requested to the moment it's delivered? For a software team, that journey might look like Backlog -> To Do -> In Progress -> In Review -> Done.
Clearly defining these stages is non-negotiable. It makes sure everyone on the team is measuring from the same starting lines, which is the only way to get trustworthy data.
To make this concrete, you need to tie the concepts of lead and cycle time to specific, observable events in your workflow.
Data Points for Measurement
The table below shows how to define these start and end events for a few common scenarios, giving you a solid foundation for accurate measurement.
| Scenario | Lead Time Start Event | Cycle Time Start Event | Process End Event |
|---|---|---|---|
| Software Feature | Ticket created in backlog | Ticket moved to 'In Progress' | Feature deployed to production |
| IT Support Ticket | User submits the ticket | Technician assigns ticket to self | Ticket is marked as 'Resolved' |
| New Hire Onboarding | HR sends device request | IT begins device configuration | Employee receives and logs into device |
| Manufacturing Order | Customer places the order | Production begins on the assembly line | Order is shipped from the warehouse |
This structured approach strips away ambiguity. It turns the abstract ideas of lead time and cycle time into something you can point to and measure.
Automated Tracking with Project Management Tools
Most modern teams use tools that can do this heavy lifting. Platforms like Jira, Asana, or Azure DevOps are built to track work moving through a workflow, automatically timestamping every status change.
This is by far the easiest way to get started. If you configure your project board to mirror your real-world process, these tools can generate reports on lead and cycle times with almost no manual effort. The only catch is that your team has to be diligent about updating ticket statuses. If a developer is working on a task but the ticket still says 'To Do', your data is wrong.
The most sophisticated measurement tool is useless if your team doesn't follow the process. Consistent status updates are the bedrock of accurate metric tracking. Your data is only as good as your team's discipline.
Advanced Visualization Techniques
Once you have a steady stream of basic data, you can use more advanced tools to bring it to life. Visual charts make it easier to spot trends, outliers, and bottlenecks than staring at a spreadsheet of numbers.
Cumulative Flow Diagrams (CFDs): A CFD is a stacked area chart showing how much work is in each stage of your process over time. The horizontal gap between the first and last lines on the chart is your average lead time, while the gap between your 'In Progress' and 'Done' lines represents your cycle time. It’s an effective tool for seeing where work is piling up.
Control Charts: Instead of averages, a control chart plots the cycle or lead time for every single task that gets completed. It then calculates a mean and standard deviation, showing you the predictable range of your team's performance. Any task that falls way outside this range is an outlier that needs investigation. These charts are perfect for understanding and improving the predictability of your process.
The goal isn't to build complicated dashboards for the sake of it. Start simple. Use the automated reporting built into your project management tool. Once you get a feel for that data, you can graduate to more powerful visualizations like CFDs to get a deeper understanding of your workflow's health.
Using Data to Actually Improve Your Workflow
Measuring lead time and cycle time is a waste of effort if you don’t act on what you find. The goal isn’t to stare at numbers on a dashboard; it’s to use those numbers to make changes that deliver value faster. The data shows you where the friction is. Your job is to smooth it out.
The relationship between lead time and cycle time is your first clue. If one is high and the other is low, you know where to start digging.

Scenario 1: High Lead Time, Low Cycle Time
This is the classic bottleneck. Your team is quick and efficient once they get started, but tasks sit in a queue forever before anyone touches them. The problem isn’t your team’s ability; it's the process before the work begins. You have a wait time problem.
To solve it, you need to attack the queues.
- Tame the Backlog: Your backlog isn't a wish list. It should be an ordered, prioritized queue of what's next. If it’s clogged with stale ideas, low-priority items, or vague requests, it creates noise. Groom it aggressively.
- Limit Work in Progress (WIP): This is the single most powerful lever you can pull. When too many tasks are active at once, everything grinds to a halt from context switching. Lowering your WIP limits forces the team to finish what they’ve started, which shrinks wait times.
- Fix Slow Handoffs: Does a task wait days for a code review? Or for an approval from another department? Map out every point where work gets handed off. These are almost always where hidden delays are lurking.
The insights you gather here are fundamental to figuring out how to improve operational efficiency across your entire workflow. It’s about making the system smoother, not just telling people to work harder.
Scenario 2: High Cycle Time
If your cycle time is high, the issue is with the work itself. Once a task is started, it takes a long time to get it done. This points to friction during the active work phase, not before it.
The solutions here are often more technical or skill-focused.
- Automate Everything Repetitive: Are your developers running manual build processes? Is your IT team configuring every new laptop by hand? Pinpoint the most time-consuming, repeatable steps in your process and automate them.
- Upgrade Team Skills and Tools: A long cycle time can signal that the team is missing the right skills, knowledge, or tools for the job. Investing in training, better documentation, or more effective software can directly cut down the time it takes to complete a task.
- Eliminate Interruptions: Constant interruptions are a cycle time killer. Every time a developer has to stop to answer a question or jump on an unplanned call, their focus shatters. Protecting blocks of "deep work" time is a simple but effective fix.
This whole process is about turning raw data into smarter choices. You can explore this concept further in our guide on moving from data to decisions.
Little's Law as a Mental Model
There’s a simple mathematical relationship that governs any system with a queue, known as Little's Law. It states:
Lead Time = Work in Progress / Throughput
This formula gives you a reliable mental model for managing your workflow. It proves that if you want to reduce lead time, you have two options: either reduce the amount of Work in Progress (WIP) or increase your Throughput (the rate you complete work). Focusing on limiting WIP is almost always the easier and faster way to see results.
This isn't just for software teams. The principle applies everywhere, even to national economies. For example, the structure of the Dutch labor market influences national cycle times. Strict regulations can make hiring a slow process, increasing the cycle time for companies trying to adapt to new demands. This shows how structural rules—not just team efficiency—can impact lead times in any system.
Your metrics have to drive action. By diagnosing whether your problem is wait time or work time, you can apply targeted, effective solutions instead of just telling everyone to "work faster."
Getting Practical with Lead and Cycle Time
Once teams start to see real numbers for lead and cycle time, the practical questions start. It's one thing to have the data; it's another to know what to do with it. Let's clear up some of the most common points of confusion to make these metrics genuinely useful.
The first question is always the same: "So, what's a good lead or cycle time?" The honest answer is that there's no magic number. What's considered "good" for a massive new software feature would be a disaster for a simple IT support ticket.
Your goal isn't to chase some arbitrary industry benchmark. It's to find your own baseline and then focus on making small, sustainable improvements. Your most important benchmark is your own performance last month.
How These Metrics Fit with Throughput and WIP
Another area of confusion is how lead and cycle time relate to other key metrics like throughput and Work in Progress (WIP). They aren't isolated numbers—they're all mathematically connected, each describing the same system from a slightly different angle.
- Throughput: Think of this as your completion rate. It’s the number of work items you finish in a set period, like completing eight support tickets per week.
- Work in Progress (WIP): This is the number of tasks currently active in your workflow at any given moment.
These three metrics are bound together by Little's Law. It proves that your average lead time is a direct result of how much work you have in progress and how fast you can finish it. High WIP will always lead to longer lead times, even if your team is working incredibly fast.
Your system is a whole. You can't change one of these metrics without affecting the others. For example, if you lower your WIP, your lead time will almost certainly drop, even if your cycle time and throughput stay the same.
Should Testing and Code Review Be Part of Cycle Time?
This is a classic debate for software teams. Does cycle time stop when a developer pushes the code, or does it need to include testing and review? The answer depends on what you mean by "work."
The most effective approach is to define cycle time to cover every step needed to get a task to a truly "done" state—meaning it's ready to be delivered.
If a task can't be considered complete until it has passed a code review and QA testing, then those stages absolutely should be included in your cycle time. Leaving them out just hides bottlenecks. If code sits for three days waiting for a review, that's a real delay in your process, and your cycle time needs to reflect that reality.
Consistency is what matters most.
Define your process stages clearly and make sure everyone sticks to them. Whether you include code review in your cycle time is less important than ensuring the entire team measures it the same way, every time. If you don't, your data becomes worthless for tracking improvements.
Ultimately, these metrics are just tools. They’re meant to spark conversations and shine a light on the hidden friction in your workflow. The biggest mistake is obsessing over the numbers themselves instead of the process problems they reveal. Use them to ask better questions: Where is work getting stuck? Why did that one task take so much longer than all the others? Answering those questions is what drives improvement.
Turn real usage data into smarter workflow decisions without compromising on privacy. With WhatPulse, your team can identify bottlenecks, track tool adoption, and measure the impact of process changes with fully transparent, privacy-first telemetry. See how work really happens at https://whatpulse.pro.
Start a free trial