
Real time monitoring is a live dashboard for your company’s digital pulse. Instead of waiting for weekly reports to tell you what happened, you see what’s happening with your software and workflows right now. This means you can react to issues immediately, not days later.
What Real Time Monitoring Actually Means
Real time monitoring is the difference between looking in the rearview mirror and looking through the windshield. Traditional reporting is like developing a photograph; you only see the results long after the moment has passed. Real time monitoring is like a live video feed.
This continuous stream of information lets an organization track operational data as events happen. A logistics company can track its delivery fleet on a live map instead of reviewing reports at the end of the day. The live map allows for immediate course corrections. The same principle applies in an office to software rollouts, application usage, and team productivity.
From Lagging Indicators to Leading Decisions
The biggest benefit is the shift from lagging indicators (what happened last week) to leading information (what is happening now). This changes how you operate in fast-moving work environments.
- Software Adoption: See if that new tool you rolled out is being used by the team, or if it’s collecting digital dust.
- Performance Bottlenecks: Instantly spot if an application is hogging network bandwidth and slowing down other systems.
- Workflow Inefficiencies: Notice patterns like excessive switching between applications, which might point to a broken process or a need for better tool integration.
The goal of real time monitoring isn't to micromanage, but to get a high-level, aggregate view of operational health. It's about spotting trends and solving small problems before they become big ones.
This approach is different from simply tracking tasks. A project management tool tells you a task is marked 'complete', but real time monitoring shows you the context behind the work—what tools were used and how much focused time was involved. Understanding the difference between tracking vs measuring is a necessary first step toward building an effective system.
Real time monitoring replaces guesswork with direct evidence, giving you the data to make faster decisions. You can optimize resources, smooth out workflows, and respond to operational needs with more precision.
Real Time Monitoring vs Traditional Reporting
To make the distinction clearer, here's a side-by-side comparison. The table shows the differences in speed, data granularity, and business impact.
| Aspect | Real Time Monitoring | Traditional Reporting |
|---|---|---|
| Data Speed | Instantaneous, data streams in as it happens | Delayed, often compiled daily, weekly, or monthly |
| Decision Making | Proactive, allows for immediate adjustments | Reactive, based on historical data |
| Granularity | High, can show moment-to-moment activity | Low, usually provides summarized overviews |
| Business Impact | Prevents issues, optimizes live operations | Analyzes past performance to inform future strategy |
Traditional reporting isn’t obsolete—it’s good for long-term strategic planning. But for managing the day-to-day, real time monitoring provides the agility required to stay ahead.
Understanding the Data That Powers Monitoring
Effective real-time monitoring isn’t about collecting everything; it’s about collecting the right things. The system pulls together three non-invasive data streams to build a picture of how digital work gets done. Each stream provides a different piece of the puzzle. When combined, they create a comprehensive view of operational efficiency.
This map shows how these data sources connect to live dashboards, which in turn inform decisions.
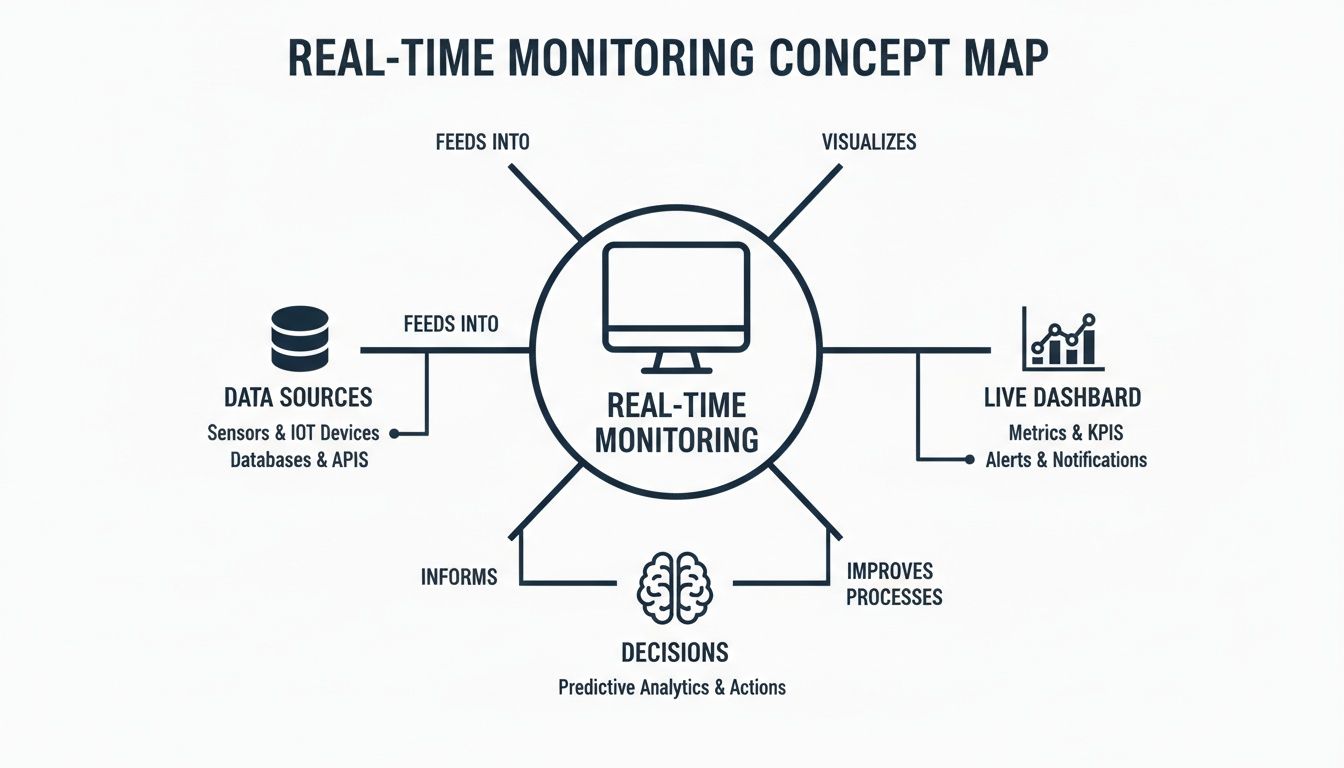
It’s a simple flow: raw, anonymous data is gathered from various sources, visualized in a central dashboard, and used to make evidence-based choices.
Application Usage Data
The most direct data point is tracking which applications are running and for how long. This isn't about judging individuals, but about understanding tool adoption and resource allocation on a large scale. The data answers basic questions about your software investments.
For example, you might find a new design tool, intended for a team of 50, is only actively used by five employees. That insight flags a potential problem with training, tool suitability, or communication, letting you address it before the license renewal. It's a straightforward way to spot shelfware and cut wasted spending.
This data is also useful for IT teams managing software deployments. They can see which machines are running outdated versions of software or confirm a security patch has been applied across the organization.
Input Activity Signals
This data stream tracks general keyboard and mouse interactions. It does not record what is typed or where the mouse clicks. It only measures the presence of activity, serving as a general indicator of user engagement with a machine.
Its primary function is to distinguish between different work states. It can help identify long periods of focused work versus times of high context-switching, where a user is frequently jumping between different tasks and applications.
Anonymised input activity helps quantify operational friction. It's not about tracking people, but about understanding patterns that indicate process bottlenecks or tool-related frustrations.
By analyzing these patterns in aggregate, managers can spot trends. A sudden spike in context-switching across a team might suggest an excessive meeting load or an inefficient workflow that requires toggling between different platforms.
Network Telemetry Insights
The third data source is network telemetry. This measures the amount of data each application sends and receives over the network. Think of it like a utility meter for your software, showing how much bandwidth each program consumes.
This information is useful for diagnosing performance problems. If the network suddenly slows down, telemetry can pinpoint the cause—perhaps a new application is unexpectedly hogging data in the background. It gives you evidence for effective troubleshooting.
For hybrid and remote teams, this is especially useful. It helps ensure that home network limitations don't become a barrier to productivity by identifying software that may not be a good fit for low-bandwidth connections. All this information can be aggregated and visualized in a central dashboard. You can learn more about exporting monitoring data for custom analysis to create your own reports.
Practical Business Uses for Real Time Monitoring
The data from real time monitoring translates into tangible results for different parts of the business. By watching live operational data, you can stop reacting to problems and start proactively optimizing things, making decisions based on evidence instead of a hunch.

It’s a simple pattern. You spot a problem or ask a question, the data gives you a clear answer, and that answer leads to a business decision that saves money, boosts efficiency, or cuts operational risk.
Optimise Software Licence Costs
For finance and procurement teams, one of the quickest wins is slashing software waste. Many organizations pay for more software licenses than people use. Real time monitoring shows application usage, highlighting "shelfware"—software that’s paid for but rarely opened.
Imagine a company paying for 500 licenses of an expensive design tool. Monitoring might show that only 150 employees have launched the application in the last 90 days. This gives the finance team concrete proof to slash the number of licenses at the next renewal, leading to direct cost savings.
Unused software is a hidden cost that drains budgets. Real time monitoring brings this waste out into the open, turning a fixed expense into a variable one you can manage.
This approach also flags underused tools. If a powerful analytics platform is only being used for basic reports, it’s a clear signal that you need better training to get your money's worth from that investment.
Streamline IT and DevOps Workflows
IT and DevOps teams are responsible for keeping the company's digital infrastructure healthy and secure. Real time monitoring helps, especially when rolling out new software or security updates. It provides a live, accurate inventory of what software is running on which machines.
Think about a critical security patch that needs to get to the entire organization. A week after you’ve pushed it out, how do you know if it worked?
- Deployment Tracking: A monitoring dashboard can show which machines have the new version installed and—more importantly—which ones don’t. This lets IT zero in on the specific computers that are falling behind, ensuring 100% compliance and closing security holes faster.
- Compatibility Issues: When a new app is deployed, monitoring can flag strange spikes in network traffic or high resource drain on certain machines. This points to potential compatibility problems before they become a widespread issue.
By providing this ground-truth visibility, real time monitoring helps IT teams manage change with precision, taking risk out of large-scale software updates.
Uncover Operational Bottlenecks
For operations leads and managers, real time monitoring offers a window into how work gets done. By looking at aggregated data on how often people switch between apps and how much focus time they get, you can spot hidden frictions in your processes that hurt productivity.
For instance, a team might be constantly missing deadlines. The data could reveal a pattern of high context switching, with employees jumping between their email, a chat app, and a project management tool every few minutes. This isn't a sign of lazy employees; it's a symptom of a broken workflow. Maybe notifications are out of control, or information is spread across too many platforms.
With this insight, a manager can take specific action. They could introduce "focus blocks" with no meetings, consolidate all communication into a single channel, or integrate tools to cut down on manual data entry. The monitoring data then acts as a baseline, showing whether these changes are working. You can dig deeper into this by reading about measuring hybrid work impact and its effects on work patterns.
These examples show how real time monitoring becomes a strategic asset. It gives you the objective data needed to make smarter calls on software spending, IT management, and operational efficiency, building a leaner organization.
Navigating Privacy and Data Governance
When you start monitoring work activity, employee privacy isn't just a feature. It's the foundation. Trust evaporates the moment monitoring feels like surveillance. A modern, ethical approach focuses strictly on how work happens, not what that work is.
This means you never capture what’s on the screen, log the specific order of keystrokes, or read private messages. The goal is to see operational patterns and resource usage, not to scrutinize individual actions. This distinction separates productive analysis from intrusive oversight.
To do this right, data must be pseudonymized by default, rolling up information into trends rather than individual-level reports. Your team should also have transparency into what’s being measured and why. This clarity builds the trust needed for any monitoring program to succeed.
Adhering to GDPR and Data Sovereignty
For any company with a presence in Europe, the General Data Protection Regulation (GDPR) is non-negotiable. This regulation sets a high bar for data handling, and any real-time monitoring tool must be built with these principles at its core.
A key requirement is data sovereignty. To comply with GDPR, all the data you collect should be stored on servers physically located within the European Union. This ensures the information is protected by the EU's privacy laws.
Another principle is the right to be forgotten. Employees must have the ability to request that their data be deleted, and the platform has to execute that request completely.
Choosing a tool that is GDPR-compliant by design isn't just a legal precaution; it's a clear signal to your team that you take their privacy seriously. It shows that the goal is operational improvement, not tracking individual performance.
When deploying real-time monitoring solutions, especially within human resources, it is necessary to manage the complex landscape of privacy regulations and ethical considerations, such as outlined in discussions on AI ethics and EPPA compliance in human capital risk management.
A privacy-first approach is also evident in large-scale public systems. In the Netherlands, the Nivel syndromic surveillance system is an example of real-time monitoring that respects privacy while delivering insights for public health. It tracks health trends across approximately 1.9 million citizens using pseudonymized data from general practices, enabling rapid response to infectious diseases without compromising personal data under strict Dutch regulations. Read about how this system transforms public health management to see a model of privacy-first data aggregation.
The WhatPulse Approach to Privacy
Platforms like WhatPulse Professional are built around these privacy principles. The lightweight client aggregates data on application usage, input activity, and network traffic without being intrusive. It’s designed to gather just enough data to be useful, and no more.
This method allows organizations to gain insights for license optimization or deployment tracking while maintaining employee trust. It proves that you can have effective real-time monitoring and robust privacy at the same time. The right tool makes privacy an integral part of the process, not an afterthought.
Data Governance Checklist for Monitoring Tools
Evaluating a new monitoring tool? Use this checklist to make sure its privacy and compliance features are up to scratch. It's a practical way to separate privacy-focused platforms from those that just pay lip service to it.
| Feature | What to Look For | Why It Matters |
|---|---|---|
| Data Pseudonymisation | Is data aggregated and stripped of personal identifiers by default? | Prevents individual tracking and focuses analysis on team-level trends, which is the ethical approach. |
| Data Sovereignty | Can you choose the geographic region for data storage (e.g., EU for GDPR)? | Ensures you comply with local regulations like GDPR, which mandate data storage within specific borders. |
| User Transparency | Can employees see exactly what data is being collected about their activity? | Builds trust and demonstrates that the company has nothing to hide. Transparency is key to acceptance. |
| Opt-Out/Deletion | Is there a clear process for employees to request their data be deleted (right to be forgotten)? | This is a core requirement of GDPR and other modern privacy laws. It gives individuals control over their data. |
| Minimal Data Collection | Does the tool collect only the data needed for its stated purpose? Avoid tools that capture screens or log keystrokes. | Collecting excessive data increases risk and feels intrusive. A privacy-first tool gathers just enough to be useful. |
| No Intrusive Methods | Does the platform explicitly state it does not use screen capture, keylogging, or content monitoring? | This is the line between acceptable operational monitoring and unacceptable surveillance. |
This isn't an exhaustive list, but it covers the non-negotiables. If a potential tool can't tick these boxes, it's probably not the right fit for a modern, trust-based workplace.
How to Implement Real Time Monitoring
Rolling out a real time monitoring solution isn't just about installing software. You need a clear, phased approach that earns trust and delivers value from the beginning. If you rush it or skip steps, you'll likely run into confusion and pushback. A methodical rollout ensures your teams understand the "why" behind the tool, which is as important as the "how."
Think of it as a cycle, not a one-off project. The process kicks off with defining your goals and settles into a routine of reviewing data to find ways to continuously improve.
Phase 1: Define Your Objectives and Get Buy In
Before you deploy anything, you have to know what you're trying to achieve. Vague goals like "improve productivity" don't cut it. You need to get specific.
- Financial Goal: Reduce software license spend by 15% in the next six months by finding unused applications.
- Operational Goal: Cut the average time for a critical security patch rollout from two weeks to 48 hours.
- Workflow Goal: Reduce team context-switching by 20% to create more time for focused work.
With concrete objectives, you can build a solid business case. Approach leadership with a clear problem and a data-backed way to solve it. This isn't about surveillance; it's about making smarter decisions on spending and processes.
Phase 2: Communicate and Deploy Transparently
Transparency is non-negotiable. Announce the plan to your employees before any software is installed. Explain what the tool does, what it doesn't do (no screen captures or keylogging), and how the data ties back to the business goals you’ve defined.
Frame the implementation as a way to improve tools and remove workflow friction, not as a performance management tool. This framing is critical for building the trust needed for the program to succeed.
Once everyone understands the purpose, you can deploy the lightweight client software across all endpoints. Modern solutions can be pushed out silently with standard IT management tools, so there’s no disruption for your users.
Phase 3: Start with a Pilot Group
Don't go for a company-wide rollout right away. Start with a smaller, controlled pilot group—a single department or project team. This approach lets you work out any kinks in a low-stakes environment.
A pilot serves several purposes:
- Validate Objectives: You can test if the tool is capturing the data needed to hit your initial goals.
- Fine-Tune Dashboards: Configure your dashboards to show the most relevant metrics for that team's needs.
- Gather Feedback: The pilot group can give you feedback on the process and help you polish your communication strategy.
- Create Champions: A successful pilot creates internal advocates who can speak to the tool's benefits, making the wider rollout much smoother.
Phase 4: Configure Dashboards and Establish Routines
After the pilot confirms your approach is solid, roll out the client to the rest of the organization. Now, the focus shifts from implementation to ongoing use. Configure your main dashboards to track the key metrics you identified back in Phase 1.
This is not a "set it and forget it" tool. You need a regular cadence for reviewing the data. A monthly review with finance can tackle license optimization, while a weekly check-in with IT can monitor deployment progress. To effectively implement real time monitoring, businesses often lean on specialized tools. You can explore some of the network security monitoring tools available to support your security and network telemetry goals.
The recent surge in AI adoption shows the value of this kind of systematic tracking. Statistics Netherlands (CBS) reported that corporate AI usage in the country jumped from 9.9% in 2020 to 22.7% in 2024. The AI Monitor 2024 program achieves this by building a coherent picture from varied data points—much like a well-implemented endpoint monitoring system gives CIOs a clear view of tool usage. This structured approach is what turns real time monitoring from a technical capability into a core business process.
Measuring the Success of Your Monitoring Programme
You have a real-time monitoring programme running. How do you know if it's making a difference? You measure its return on investment (ROI) by connecting the data directly to the business problems you wanted to solve.
A dashboard full of charts is just noise unless it answers specific questions and shows real change. Without that clear link, you’re collecting data for the sake of it. Success is a number on a balance sheet, a project delivered ahead of schedule, or a team working more smoothly. The trick is to tie every metric to a concrete business outcome.
Linking Metrics to Business Cases
For every goal you set during implementation, you need a matching metric. This is how you turn monitoring data from a simple report into a performance indicator for your business.
- For License Optimisation: Success is measured by the reduction in your annual software spend. If your goal was to cut costs by 15%, your dashboard should show exactly which unused licenses were dropped to hit that number.
- For Deployment Tracking: Success is about speed and completion. The key metric is how long it takes to get a critical update or a new application to 100% rollout. A successful programme might slash deployment time from two weeks to 48 hours.
- For Productivity Improvements: This is more nuanced, but still measurable. You can track things like a decrease in context switching between apps or an increase in focus time on core software. Success means your team is spending more of their day on high-value work, not just juggling tabs.
The most important step is to set a clear baseline before you make any changes. You can't prove improvement if you don't know where you started.
This baseline is your benchmark. Once you have it, you can use the real-time monitoring data to see the real impact of your changes. Did consolidating your communication tools actually cut down on app switching? The data will give you a straight answer.
This approach turns a simple dashboard into a strategic asset. It creates a continuous feedback loop that fuels ongoing improvement, helping you refine processes, justify budgets, and make smarter decisions based on hard evidence instead of guesswork.
Still Have Questions About Real-Time Monitoring?
If you’re new to real-time monitoring, a few questions probably come to mind. Most people are curious about privacy, performance, and how this fits in with the tools they already use.
Does Real-Time Monitoring Mean My Boss Is Watching My Screen?
Absolutely not. That’s surveillance, not monitoring.
Ethical monitoring tools gather anonymized data about how work gets done, not who is doing what. They do not record screens, log specific keystrokes, or read your messages. The goal is to see broad trends—like which applications are used most often or are crashing—so the company can improve tools and processes for everyone.
It's about making work better, not watching over your shoulder.
How Is This Different from a Project Management Tool?
This is a good question because the two are often confused. They answer completely different things.
Tools like Jira or Asana track the progress of a task you manually log. Real-time monitoring shows what it took to complete that task, running quietly in the background across all your applications.
Think of it this way: project management software answers, "Is the task marked as complete?" Real-time monitoring answers, "How much focused time and effort went into getting it done?" The two work together. One tracks the project, and the other measures the operational effort behind it.
Will This Kind of Software Slow Down My Computer?
No. Any modern monitoring solution is built to be lightweight.
A well-designed client, like the one from WhatPulse, is engineered for a minimal footprint. It uses very few system resources and runs silently in the background. A tool meant to measure work should not get in the way of you doing it.
Ready to turn operational data into smarter business decisions? See how WhatPulse provides privacy-first real-time monitoring to optimise software spend, streamline IT, and improve workflows. Start analysing your operations today.
Start a free trial