
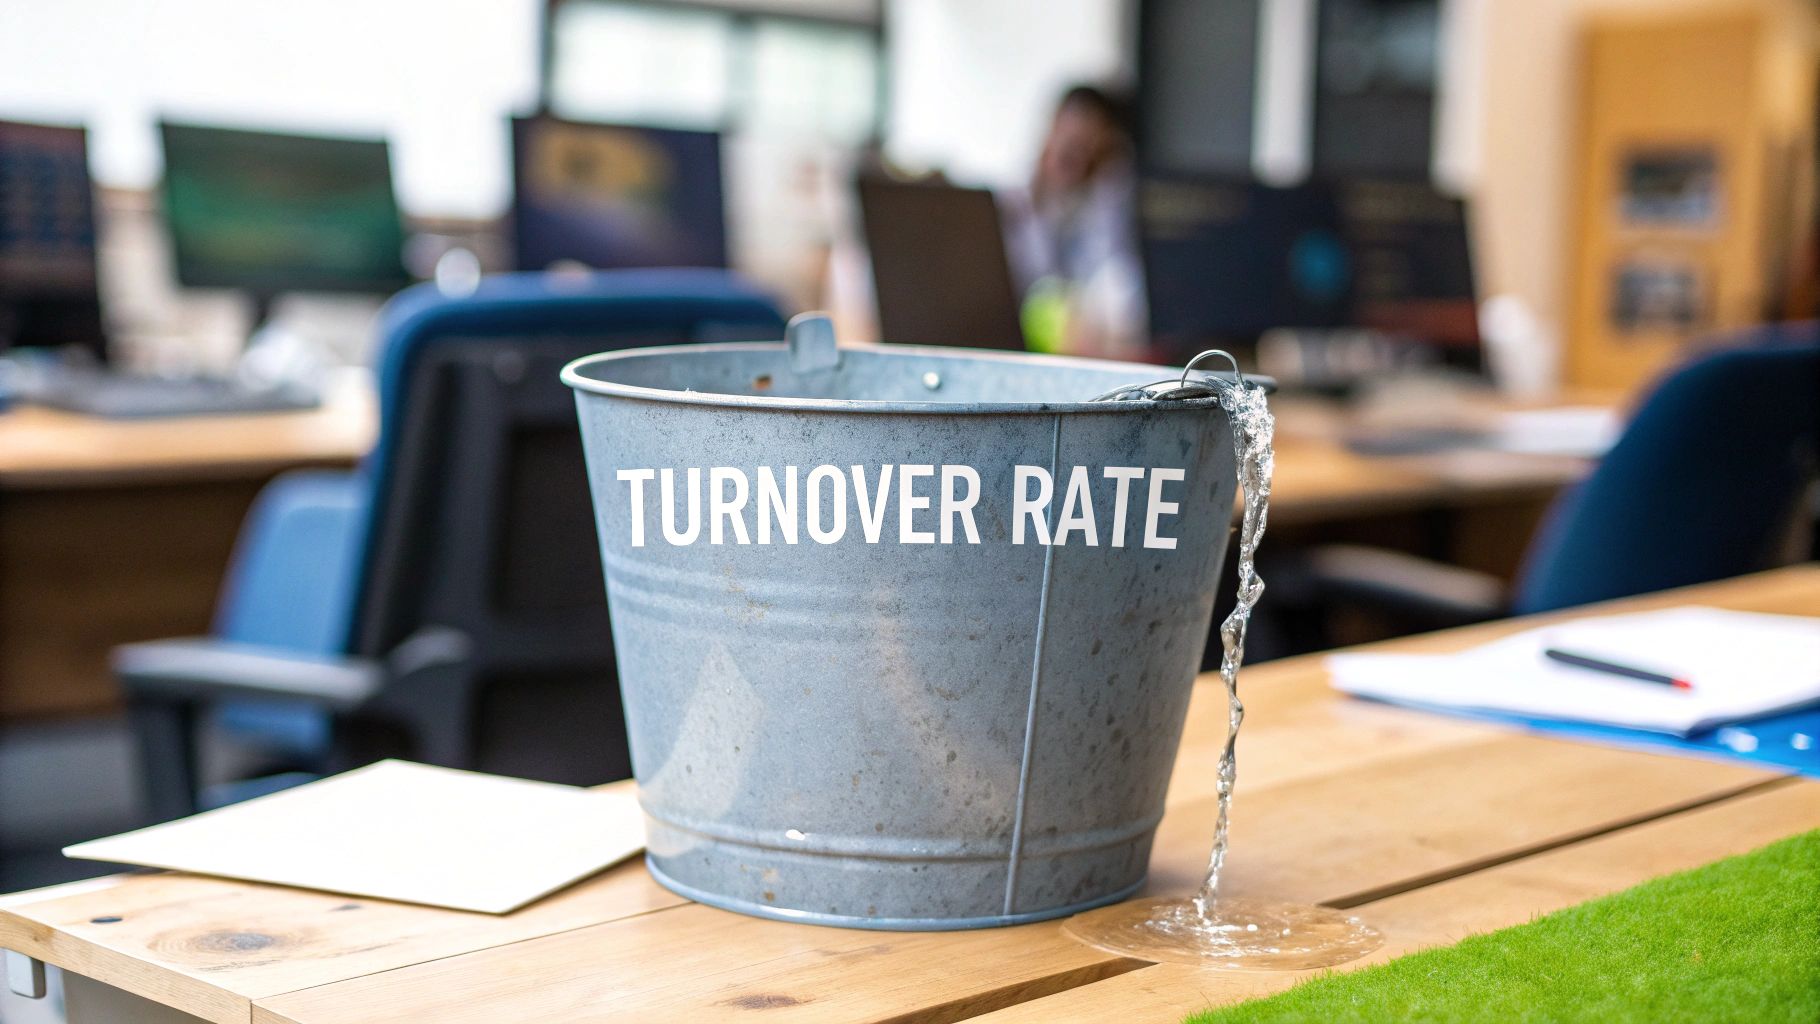
Your labour turnover rate is a number showing how fast people are leaving your company. A high rate suggests employees are exiting frequently, pointing to problems with retention or workplace culture.
It tells you how leaky your employee bucket is.
Why Your Labour Turnover Rate Is a Core Business Problem

Many businesses treat employee departures as a standard HR task. This is a mistake. A high labour turnover rate causes direct financial and operational damage that affects IT, operations, and finance.
To manage this, you need to understand what employee turnover is. It's a number that reflects the real-world stability of your business.
This is especially true in a tight job market. In the Netherlands, the labour market saw a large jump in people switching jobs. In the first quarter of 2022, 1.9 million people started a new job—400,000 more than in the same period a year earlier. With 123 vacancies for every 100 unemployed people at the time, employees had more choices.
The Financial and Operational Risks of High Turnover
When someone leaves, the costs are both obvious and hidden. The cost of a job ad is simple to calculate, but the real damage is a cascade of disruptions that spread through different teams.
Each time a person leaves, others have to take on their work. This often leads to burnout and a drop in productivity. Projects stall, deadlines are pushed back, and institutional knowledge—expertise about systems, clients, and processes—disappears.
A high turnover rate is a symptom, not the disease. It signals deeper problems in management, culture, or compensation that need to be fixed.
Measuring these effects requires a focused approach. Our guide on leveraging human resource analytics can give you more insight into how to quantify the business impact.
The table below breaks down how turnover hits different parts of your business.
Direct Business Impacts of High Labour Turnover
A summary of the primary operational and financial consequences of a high labour turnover rate.
| Impact Area | Specific Consequence | Relevant Team |
|---|---|---|
| Financial Costs | Increased recruitment agency fees, advertising, and onboarding expenses. | Finance, HR |
| Operational Strain | Project delays, missed deadlines, and reduced output from overburdened staff. | Operations, Project Management |
| Knowledge Loss | Loss of expertise on internal processes, client relationships, and legacy systems. | All Teams |
| IT and Security | Time spent on offboarding, de-provisioning accounts, and securing company data. | IT, Security |
| Team Morale | Decreased engagement and motivation among remaining employees who feel overworked. | All Teams |
The consequences are not isolated. They create a domino effect that can weaken your entire operation if left unchecked.
How to Calculate Your Labour Turnover Rate Accurately
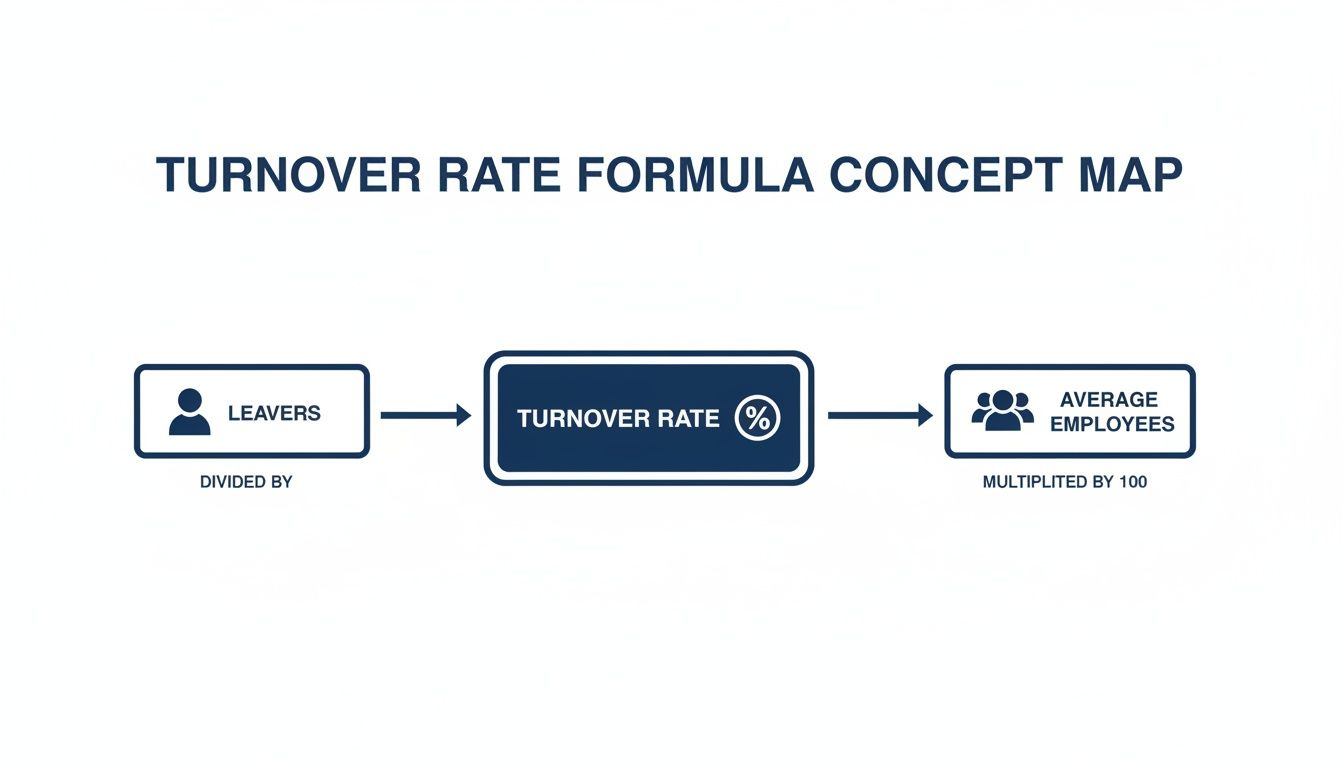
Calculating your labour turnover rate is straightforward, but accuracy is important. If the numbers are off, you're making decisions based on faulty data. The standard formula provides a solid foundation for analysis.
(Total Number of Leavers in a Period / Average Number of Employees in that Period) x 100 = Labour Turnover Rate %
This equation produces a percentage that shows what proportion of your workforce left during a specific timeframe. A result of 10% means that for every 10 employees you had on average, one left.
Breaking Down the Formula
Let's look at each component.
"Total Number of Leavers" is a simple headcount of every employee who separated from the company in your chosen period, whether they resigned, retired, or were let go.
The "Average Number of Employees" is where mistakes can happen. You cannot just use the number of employees you have on the payroll today. You need an average to account for new hires and departures.
To get this number, follow these steps:
- Count your employees at the start of the period. (e.g., 1 January)
- Count your employees at the end of the period. (e.g., 31 March)
- Add these two numbers together.
- Divide the total by two.
This gives you a reliable average. If your company experiences large seasonal swings or is growing rapidly, you can get more precise by adding the headcount from the end of each month and dividing by the number of months in your period.
A Practical Example
Let's apply this with a fictional tech company, "InnovateNL," looking at its first quarter (January to March).
- Employees at the start (1 Jan): 120
- Employees at the end (31 Mar): 130
- Number of employees who left during Q1: 9
First, we need the average number of employees for the quarter:
- (120 + 130) / 2 = 125 average employees
Now, we can use the turnover formula:
- (9 leavers / 125 average employees) x 100 = 7.2%
InnovateNL’s labour turnover rate for Q1 was 7.2%. This single number is the starting point for asking more detailed questions.
Going Deeper with Different Timeframes
You can calculate turnover for any period, but the most common are monthly, quarterly, and annually. Each tells a different story.
- Monthly Rate: Good for spotting sudden spikes. A high monthly rate might flag an immediate problem, like the fallout from a difficult manager's departure or a poorly communicated company change.
- Quarterly Rate: Offers a more stable view. It smooths out the random noise of a single month, giving you a better sense of short-term trends.
- Annual Rate: The standard for big-picture, strategic planning. It is used for comparing year-over-year performance and setting long-term retention goals. Calculating an accurate headcount here often involves working out how to count full-time equivalents, especially if you have many part-time staff.
Adding Context with Voluntary vs. Involuntary Turnover
A single turnover number tells you how many people left, but it doesn't tell you why. For a useful analysis, you need to split your leavers into two groups.
- Voluntary Turnover: Employees who chose to leave—they resigned or retired. This is often the most important number to watch, as it can point directly to problems with job satisfaction, management, or company culture.
- Involuntary Turnover: Employees who were asked to leave, through terminations or redundancies.
Calculating separate rates for each gives you a much clearer picture. A high voluntary turnover rate is a red flag that your best people might be leaving, while a high involuntary rate could suggest issues with your hiring process.
Sorting Through the Different Types of Employee Turnover
Not all departures are the same. Lumping every leaver into one labour turnover rate can hide the real story. A top engineer resigning is a different problem from an underperforming sales representative being let go.
To diagnose your situation, you need to sort turnover into different categories. The most common distinction is between employees who choose to leave and those who are asked to leave. This simple split adds necessary context to your data.
Voluntary vs Involuntary Turnover
Voluntary turnover is when an employee decides to resign. Managers worry about this category because it often signals issues with job satisfaction, management, compensation, or company culture. When good people leave on their own terms, it's a warning sign.
The Netherlands provides a clear example of a market with high voluntary turnover. A record 1.9 million job starts were recorded in Q1 2022, a 27% increase from the previous year. This was driven by a tight labour market where there were 123 jobs for every 100 unemployed people, giving employees power to seek better opportunities. You can find more information about the Dutch labour market turnover statistics on the CBS website.
Involuntary turnover is initiated by the employer. This includes terminations for poor performance, redundancies, or policy violations. A high rate here points to different problems, like a flawed hiring process or ineffective performance management.
Your overall turnover number tells you if you have a problem. Segmenting it into voluntary and involuntary tells you where to start looking for the cause.
The formula for calculating your turnover rate is straightforward.
By applying this calculation to each type of turnover, you can see which category is driving your overall rate.
Desirable vs Undesirable Turnover
Beyond who made the decision, you can also classify turnover by its impact on the business. This adds another dimension to your analysis, helping you separate healthy departures from harmful ones.
Desirable Turnover: This is when underperforming or disengaged employees leave. While it still involves replacement costs, their departure can open a spot for a more productive team member and may improve team morale.
Undesirable Turnover: This is the most damaging category. It occurs when your top performers, key leaders, or employees with critical institutional knowledge decide to leave. This type of turnover harms productivity, innovation, and long-term stability.
Combining these categories gives you four distinct types of turnover to track. The following table compares them, outlining their causes and what they mean for your business.
A Comparison of Labour Turnover Types
This table breaks down the different forms of employee turnover to help leaders diagnose their specific situation.
| Turnover Type | Definition | Example Scenario | Business Implication |
|---|---|---|---|
| Voluntary, Undesirable | A high-performing employee chooses to leave for a better opportunity. | Your lead software architect resigns to join a competitor. | High risk; loss of critical talent, knowledge, and productivity. |
| Voluntary, Desirable | A disengaged or low-performing employee resigns. | An employee who frequently misses deadlines quits. | Low to moderate risk; opportunity to replace with a better fit. |
| Involuntary, Undesirable | A valued employee is made redundant due to restructuring. | A skilled marketing manager is let go during budget cuts. | Moderate risk; loss of talent and potential damage to morale. |
| Involuntary, Desirable | An employee is terminated for consistent poor performance. | A salesperson who fails to meet targets is dismissed. | Low risk; improves team performance and upholds standards. |
Analyzing your labour turnover rate through these lenses turns a single metric into a nuanced diagnostic tool. It’s how you start to understand the why behind the numbers and build a retention strategy that works.
Figuring Out What Causes High Labour Turnover

A high labour turnover rate is rarely a single problem. It's often a combination of issues that build up until your best people start to leave. Getting to the bottom of why they're leaving is the only way to build a workplace they'll want to stay in.
People don’t usually quit jobs they love. They quit bad managers, toxic environments, and roles with no future.
Ineffective Management and Leadership
Managers have the most direct, day-to-day impact on an employee's work life. A poor relationship is one of the biggest reasons people leave. This isn't just about personality clashes; it's often a failure of core management skills.
For example, a manager who gives vague instructions leaves their team feeling confused. Another failure is the lack of meaningful feedback. If employees only find out how they're doing once a year, they feel disconnected the other 364 days.
Stagnant Career Development
Most people want to see a future for themselves at work. If they can't, they'll look for it somewhere else. A lack of growth opportunities is a large driver of turnover.
This feeling of being stuck can appear in a few ways:
- No clear promotion path: Employees see a ceiling, not a ladder.
- Limited training opportunities: The company doesn't invest in upskilling its team, leaving them feeling their skills are going stale.
- Repetitive, unchallenging work: The job becomes a monotonous loop with no chance to take on something new.
When your team feels like they're treading water, their engagement drops. It’s only a matter of time before another company offers them the growth they’re seeking.
Uncompetitive Compensation and Benefits
While not always the top reason people leave, pay is always a factor. If your compensation lags behind the market rate, you are inviting competitors to poach your best talent. It becomes a simple financial decision for them.
It’s not just about the salary. Today’s employees expect a benefits package that supports their well-being. A Gallup survey found that work-life balance and personal well-being are as important as pay when seeking a new job.
A high turnover rate is expensive. The Society for Human Resource Management (SHRM) estimates that replacing a single employee can cost between 50% and 200% of their annual salary.
Investing in competitive pay and meaningful benefits is almost always cheaper than constantly paying to recruit, onboard, and cover the productivity gap left by departing staff.
Poor Work-Life Balance and Burnout
The line between work and home is increasingly blurred. A company culture that ignores this will pay the price with a higher turnover rate. Chronic overwork is a fast track to burnout, and burned-out employees don't stay.
This isn't just about long hours. Poor work-life balance is often a symptom of deeper operational problems. Constant context switching—forcing someone to jump between dozens of unrelated apps and tasks all day—drains mental energy and destroys focus.
Workforce analytics can provide an early warning. Data showing teams consistently working in applications after hours or having highly fragmented focus time can signal burnout risks long before anyone resigns.
A Negative or Toxic Company Culture
Company culture is the collection of shared habits and behaviors that define the employee experience. When that culture turns toxic—marked by poor communication, blame, or a lack of psychological safety—it drives people away.
In a toxic workplace, people are afraid to speak up, ask for help, or admit a mistake. That lack of trust kills morale and makes collaboration impossible. Eventually, even your most dedicated employees will leave for a healthier, more supportive environment.
What a "Good" Turnover Rate Actually Looks Like
You’ve calculated your number. Let’s say your annual labour turnover rate is 15%. Is that good or bad?
The answer is: it depends. A single percentage without context is just a number. The real value comes from understanding what that number means for your business.
Chasing a universal "good" turnover rate is a mistake, because one doesn’t really exist. A 15% annual turnover might be fine for a retail business with many seasonal staff. For a specialized engineering firm where it takes years to build expertise, that same 15% would be a major problem.
Context is everything. You need to find the right yardstick to measure your own rate against.
Finding the Right Context for Your Numbers
To determine if your rate is high, low, or average, you need to compare it to relevant benchmarks. Don't just grab the first national average you find. A meaningful comparison requires looking at data through a few different lenses:
- Industry: A software company and a hospitality business are different. Tech roles are in high demand, which can lead to more job-hopping. Hospitality deals with seasonal and part-time staff, which naturally pushes its numbers higher.
- Role Type: The turnover rate for entry-level customer service staff won't be the same as for your senior leadership team. Comparing them directly is misleading. You need to analyze rates by job function to find your pain points.
- Location: The job market in Amsterdam is different from that in a smaller town. Local economic conditions, the number of competing employers, and regional salary expectations all affect how likely people are to stay.
Looking at your turnover this way helps you avoid making broad, inaccurate assumptions.
Why Your Own Trend Line Matters More Than External Benchmarks
While external benchmarks provide a useful reality check, the most valuable comparison is with yourself. Is your turnover rate this quarter higher than last quarter? Is the trend pointing up or down over the past two years?
Tracking your own internal trends tells you if your retention efforts are working. A rising rate is an early warning that something is wrong, even if your number is still below the industry average. A falling rate is proof that you’re moving in the right direction.
This is especially true in today’s job market. In the Netherlands, service industry turnover saw large swings, hitting a year-over-year low of -14.30% in June 2020 before rising to a high of 25.30% in 2021. Even though 2023 saw a dip, the broader eurozone vacancy rate climbed to 3.1% in late 2022—well above pre-pandemic levels. Labour shortages and retention challenges are ongoing. You can explore more of the Dutch turnover data on Trading Economics.
Chasing a specific industry number is a distraction. The goal is continuous improvement based on your own historical data. A downward trend is always a good sign, regardless of the absolute number.
Pinpointing Problem Areas by Department
A single, company-wide turnover rate can hide serious issues. An overall rate of 10% might look healthy. But what if that number is masking a stable engineering team with 2% turnover and a marketing department losing talent at 35%?
You have to break the numbers down. Calculating the labour turnover rate for each department, team, or manager turns a vague metric into a precision tool.
It shows you exactly where your retention problems are concentrated. That way, you can focus your efforts where they’ll have the most impact instead of using generic, company-wide fixes that don’t solve anyone’s problem.
Practical Strategies to Reduce Your Labour Turnover

Knowing your labour turnover rate is one thing; doing something about it is another. Lowering this number requires a deliberate, focused effort, not generic perks. The best strategies address the real reasons people leave, from their first day to their long-term career goals.
A one-size-fits-all approach rarely works. You have to listen to your employees and use hard data to make smart decisions. Here are some actions you can take to make your organization a place people want to stay.
Refine Your Onboarding Process
An employee’s first few weeks are critical. A chaotic start signals disorganization and can make a new hire regret their choice. The goal should be to make them feel integrated and productive, not just get them through paperwork.
Workforce analytics can help pinpoint where your onboarding is failing. Suppose your data shows new software engineers spend their first week just waiting for access to the development environment. Fixing that single IT workflow issue speeds up their contribution and improves their initial experience.
Offer Competitive and Transparent Compensation
Pay isn't everything, but it's a large part of the equation. If your salaries are below the market rate, you're fighting a losing battle for talent. You need to conduct regular benchmarking to ensure your compensation packages are competitive for your industry and location.
Fairness is just as important as the numbers. Clear pay bands and career levels build trust. Employees who understand how pay is decided and what they need to do to advance are less likely to feel undervalued. This clarity is a cornerstone of a strong employee value proposition model.
A Gallup study found that pay and benefits are consistently top reasons why people look for new jobs. You can't afford to ignore compensation.
Build Genuine Career Paths
Good employees get bored. If they can’t see a future at your company, they’ll look for one elsewhere. You need to provide clear, achievable ways for them to grow.
This doesn't always mean climbing the management ladder. Consider these alternatives:
- Technical Tracks: Let your expert individual contributors advance in seniority and pay without forcing them into management.
- Internal Mobility: Make it simple for people to move between departments. It lets them learn new skills and find a role that fits them within the company.
- Project-Based Growth: Give team members a chance to lead small projects or take on stretch assignments that build their capabilities.
For a deeper look at what works, see these proven strategies to reduce employee turnover for more solutions.
Foster a Healthier Work Culture
A toxic culture will undermine any other retention effort. The basics are non-negotiable: psychological safety, where people feel they can speak up without fear, and mutual respect. Beyond that, you can use data to fix specific cultural problems.
For example, your analytics might show one team is buried in meetings, leading to fragmented focus time and people working late. That’s a cultural issue, not just a scheduling one. By setting meeting-free days or coaching managers on better time management, you directly address a major source of burnout before it pushes people to quit. These small, data-driven fixes create a workplace that respects employees' time and well-being.
Answering Your Labour Turnover Questions
Once you start examining your labour turnover rate, a few questions usually come up.
How Often Should I Calculate My Labour Turnover Rate?
The right timing depends on what you’re trying to find out.
Monthly calculations are useful for catching sudden problems. A sharp spike in one month could signal an issue like a key manager resigning or a new policy that was poorly received. The downside is that these numbers can be volatile.
For a more reliable view, a quarterly calculation is often best. It smooths out random monthly blips, giving you a clearer picture of trends without waiting an entire year. Annual calculations are essential for strategic planning and comparing one year to the next.
What’s the Difference Between Turnover and Attrition?
People often use these terms interchangeably, but they describe two different things.
- Turnover is the general term for any employee departure, whether they resigned or were let go. You intend to replace the person who left.
- Attrition is when an employee leaves and you deliberately choose not to fill their role. This is usually part of a plan to reduce headcount, like after a restructuring or when someone retires.
In short, turnover is about replacing people, while attrition is about eliminating positions.
Think of it this way: Turnover keeps your headcount steady (or growing), while attrition makes it shrink. Knowing the difference helps you understand if departures are a sign of a retention problem or part of a business plan.
Can a High Labour Turnover Rate Ever Be a Good Thing?
It’s not common, but yes, a high turnover rate can sometimes be positive. If the people leaving are consistently poor performers or negatively affected the team’s culture, their exit is called desirable turnover. It can be a chance to bring in fresh talent and new perspectives.
However, this is a risky way to manage performance. A healthy organization doesn’t wait for people to quit to fix performance issues; it relies on good management and coaching. Relying on turnover to "clean house" is usually a symptom of deeper problems, like a flawed hiring process or weak leadership.
Ready to move from measuring turnover to actively reducing it? WhatPulse provides privacy-first analytics to help you spot early warning signs of burnout and disengagement, like constant context switching and excessive after-hours work. See how your teams are really working and build a retention strategy based on data, not guesswork. Learn more about WhatPulse Professional.
Start a free trial