
Imagine trying to build a house with a blueprint that never updates. That’s what old-school project planning can feel like. Gantt charts online turn that static document into a living, breathing guide for your projects, giving you a clear, real-time picture of what’s happening from start to finish. For modern teams that need to adapt on the fly and work together from anywhere, this shift isn't just helpful—it's essential.
From Static Plans to Dynamic Project Views
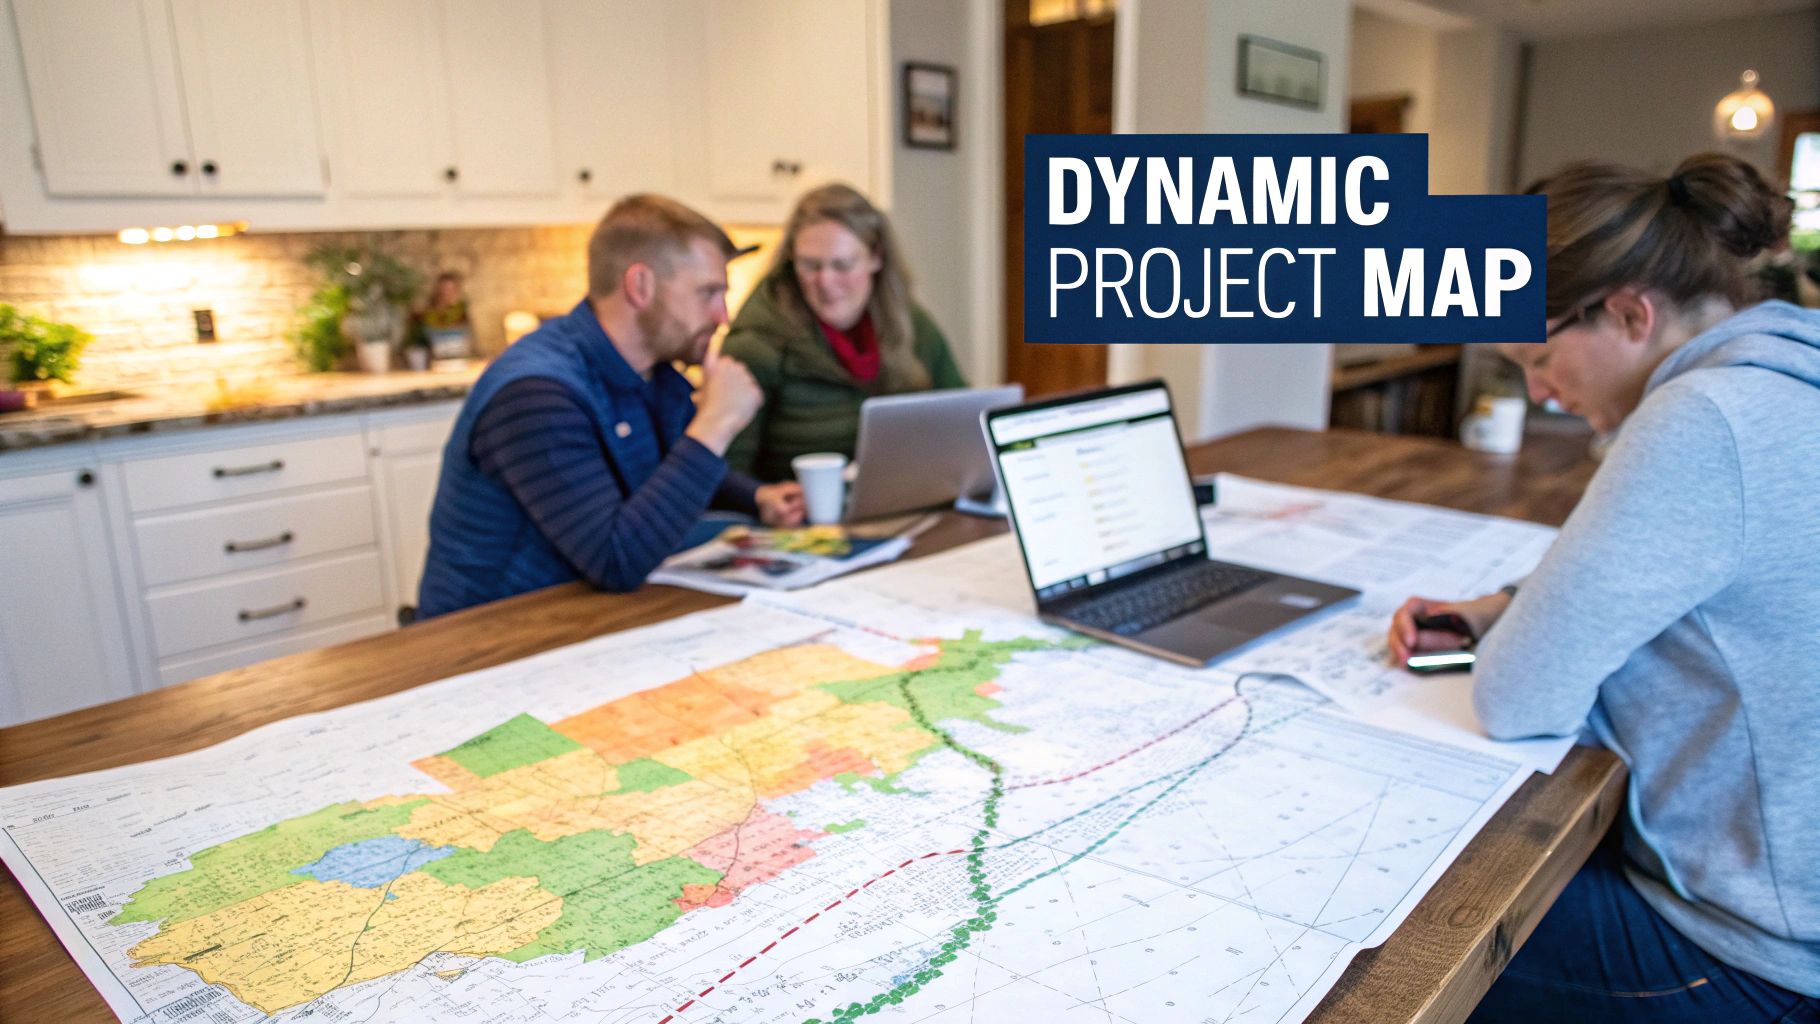
Think of your project plan like a map for a long road trip. A static plan is like a printed map from a petrol station. It shows your intended route, but it can’t tell you about the sudden traffic jam ahead, the unexpected road closure, or help you reroute if you decide to take a scenic detour. Before you know it, the map is out of date and more confusing than helpful.
That’s the core problem with so many traditional project management methods. A surprising number of teams still lean on spreadsheets. While spreadsheets are great for numbers, they're pretty clumsy for visualising a project timeline. You can definitely force one to look like a Gantt chart, but this approach has some serious drawbacks that slow things down and cause a lot of headaches.
The Limitations of Static Planning
Spreadsheet-based plans are fundamentally disconnected from the actual work being done. Keeping them updated is a manual, time-consuming chore, often falling on one project manager who has to constantly chase people for progress reports. This creates information bottlenecks and a plan that shows where the project was yesterday, not where it is right now.
The main issues with static planning are pretty clear:
- No Real-Time Visibility: The plan is only as current as its last manual update. This means stakeholders, and even the team, rarely have an accurate sense of the project's health.
- Poor Collaboration: When the official plan lives in a single file on someone's desktop, it’s nearly impossible for team members to contribute updates, see how their tasks affect others, or stay aligned.
- Difficult to Adapt: Adjusting timelines is a nightmare. A single delay means someone has to manually recalculate and shift every single dependent task. It makes the whole plan fragile and a pain to maintain.
If you've ever felt this pain, our guide on project planning in Excel dives deeper into the common traps that teams fall into. These limitations are a recipe for missed deadlines, miscommunication, and a frustrated team.
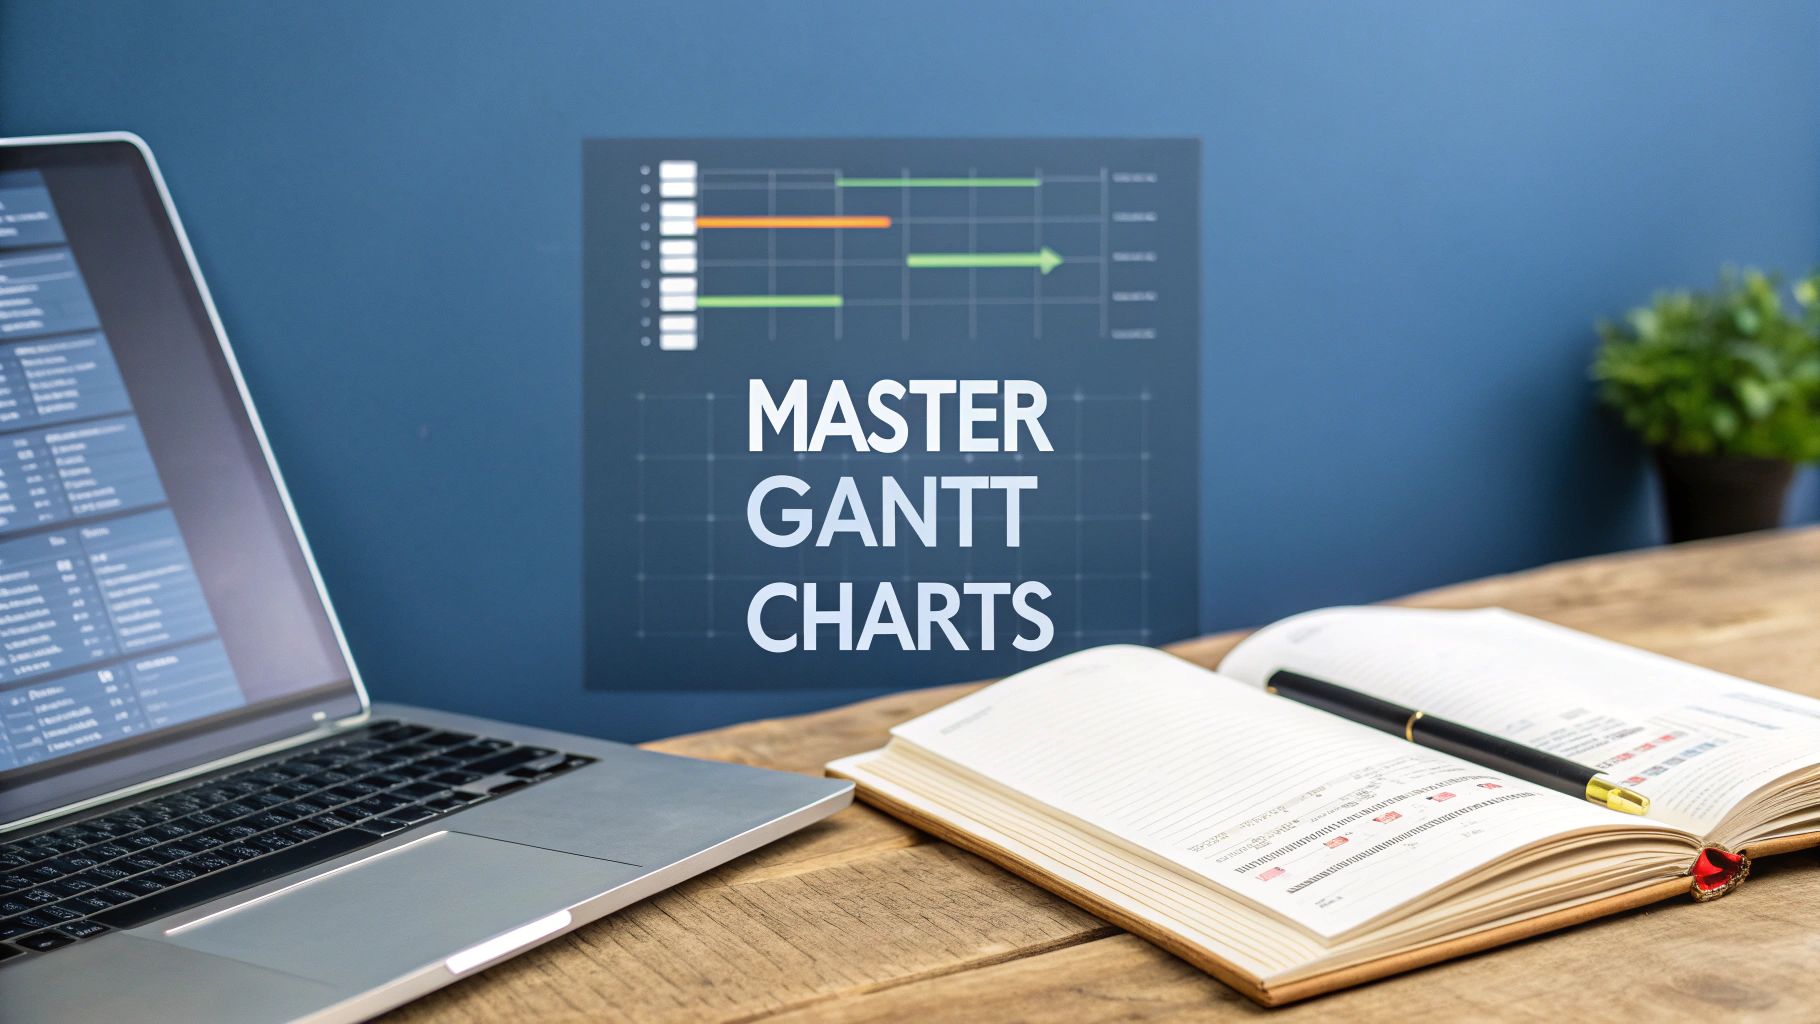
The Power of a Living Blueprint
This is where gantt charts online completely change the game. They take the visual clarity of a traditional Gantt chart and combine it with the collaborative power of the cloud. The static picture becomes an interactive, shared workspace for the whole team.
An online Gantt chart is more than just a timeline; it's the single source of truth for your entire team. It centralises communication, tracks progress automatically, and makes dependencies crystal clear, turning a complex project into a series of manageable, connected steps.
Instead of that printed map, you now have a live GPS. It shows your current location, recalculates the route when you hit a delay, and lets everyone in the car see the whole journey ahead. This dynamic approach makes managing projects more intuitive, transparent, and effective for everyone involved.
Static Spreadsheets vs Dynamic Online Gantt Charts
To see the difference in black and white, it helps to put the old way and the new way side-by-side. The jump from a spreadsheet to a dedicated online tool is less of a step and more of a leap.
| Capability | Offline Gantt Charts (Excel) | Gantt Charts Online (Cloud Software) |
|---|---|---|
| Real-Time Updates | Manual; requires one person to update | Automatic; updates as tasks are completed |
| Collaboration | Difficult; file sharing leads to version chaos | Seamless; entire team works on one live plan |
| Task Dependencies | Manual links; easily broken | Automated; drag-and-drop adjustments |
| Accessibility | Limited to devices with the specific file | Accessible anywhere with an internet connection |
| Notifications | Non-existent; relies on email or chat | Built-in; alerts for deadlines & changes |
| Integration | Isolated; requires manual data entry | Connects with other tools (e.g., chat, storage) |
Ultimately, while a spreadsheet can give you a rough sketch of your project, an online Gantt chart gives you a living, interactive model that actually helps you navigate the complexities of getting work done.
Deconstructing Your First Online Gantt Chart
At first glance, a Gantt chart can look like a complicated web of bars and lines. But once you get the hang of its core components, it becomes a powerful storytelling tool for your project. Think of it like a car engine; it seems complex from the outside, but it’s really just a few key parts working together to move you forward.
Let’s break down the essential building blocks that make up nearly every Gantt chart you'll come across. Understanding these five elements is the key to turning that blank screen into a clear, actionable project plan.
The Essential Building Blocks
Every project, no matter how big or small, can be broken down into the same fundamental pieces. Online Gantt chart software just gives you a visual way to organise them.
Here are the five core components you absolutely need to know:
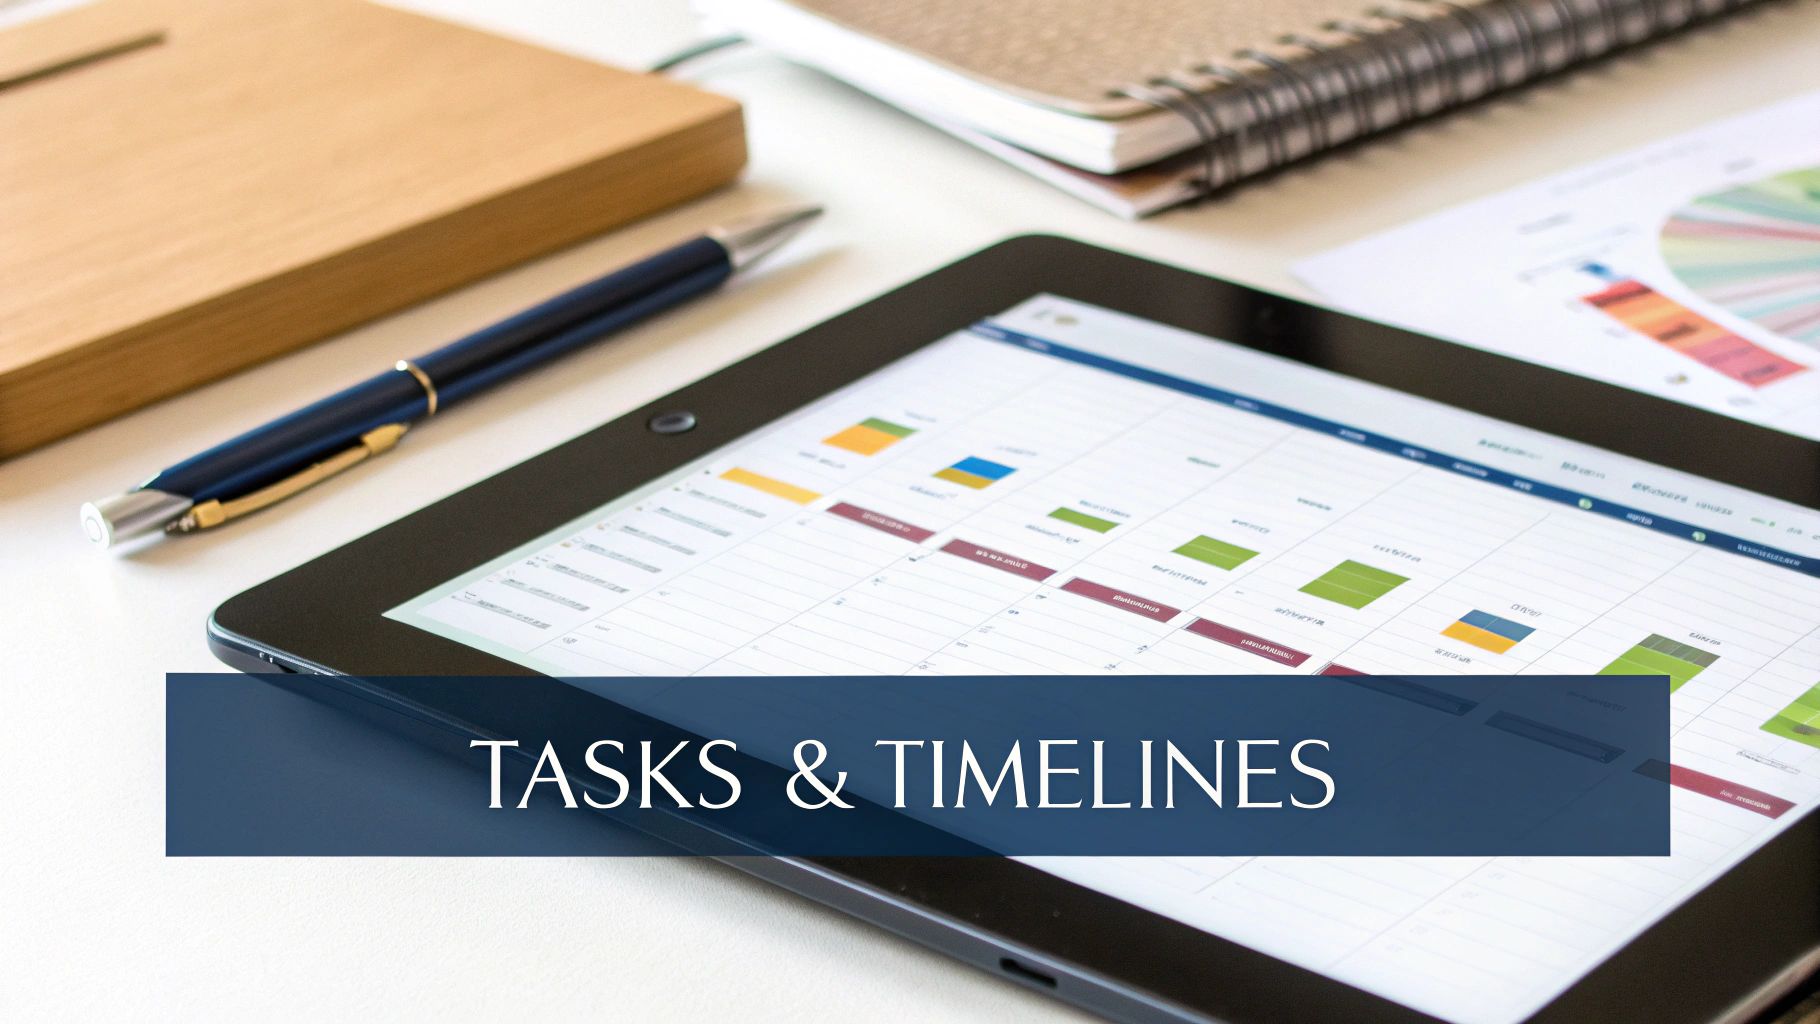
- Tasks (The 'What') These are the individual jobs that need to get done. Each task shows up as a horizontal bar on the chart, and the length of the bar tells you how long it's expected to take.
- Timeline (The 'When') This is the horizontal axis running across the top or bottom of your chart. It lays out the project's timeframe—usually in days, weeks, or months—showing exactly when each task should start and finish.
- Dependencies (The 'How') These are the connections between your tasks. You'll see them as lines or arrows, showing that one task can’t start until another is finished. It’s all about the logical order of things.
- Milestones (The 'Big Wins') These are the major events or deadlines in your project, like a product launch or getting a client's sign-off. They are often marked with a diamond or star and have zero duration. They’re your checkpoints.
- Assignees (The 'Who') This is simply the person or team responsible for a specific task. Getting ownership clear from the start is vital for keeping everyone accountable.
These components work together to give you a complete picture of your project's structure and flow. But their real value becomes obvious when you see them in action.
A Practical Example: Launching a Website
Let's apply these ideas to a common project: launching a new company website. Imagine you’re just starting the planning phase. Your initial task list is just a simple to-do list, but when you plug it into a Gantt charts online tool, it truly comes to life.
A Gantt chart transforms a simple to-do list into a strategic roadmap. It doesn't just show you what needs to be done; it shows you the order and timing required for success.
First, you’d create Tasks like 'Design Mockups', 'Develop Homepage', and 'Write Content'. Each one gets its own bar on the Timeline, scheduled with a specific start and end date.
Next, you establish the Dependencies. The 'Develop Homepage' task can't possibly start until 'Design Mockups' is finished. You’d draw a line connecting these two, creating a clear sequence. Now, if the design phase gets delayed, the development start date automatically shifts to match, keeping your plan realistic.
Then, you add your Milestones to mark critical achievements. Things like 'Client Approves Final Design' or the final 'Website Launch' become key checkpoints for the whole team.
Finally, you bring in the Assignees. Anna from the design team gets 'Design Mockups', while Ben from development is assigned 'Develop Homepage'. This clarity means everyone knows exactly what’s on their plate.
This structured approach is really catching on. In the Netherlands, the use of digital project management tools has seen a steady rise, especially among small and medium-sized businesses. In fact, data from Statistics Netherlands (CBS) showed that 61% of Dutch companies using tools like online Gantt charts reported better project completion rates and smarter resource allocation. You can dig into more of their findings on the official CBS StatLine portal.
What This Actually Means for Your Team
Knowing the parts of an online Gantt chart is one thing, but seeing how it changes a team’s day-to-day work is where you really see the payoff. This isn't just theory. Moving your projects onto a visual timeline delivers real results, turning what often feels like chaos into predictable, organised progress. It’s about getting rid of last-minute scrambles and building a more focused, collaborative rhythm.
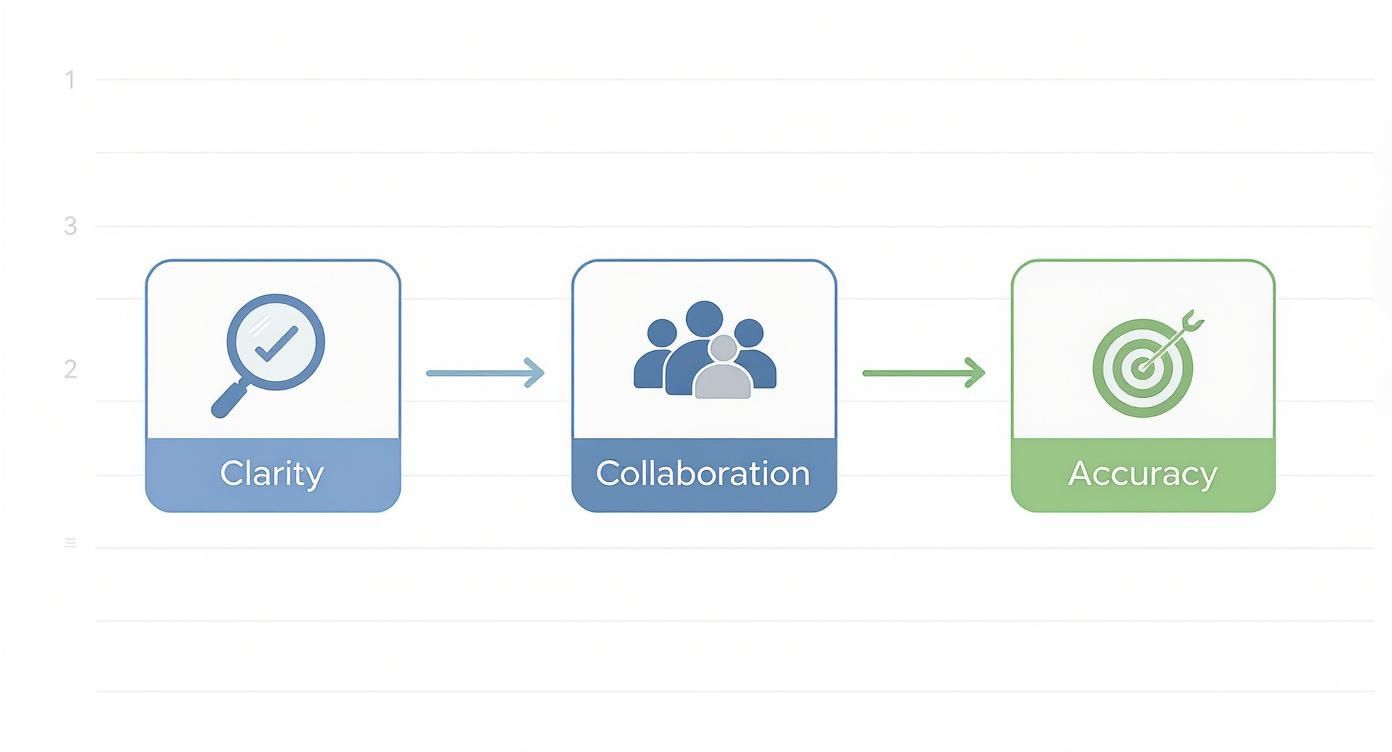
The biggest win? Total project visibility. When everyone can see the entire project from kickoff to deadline, the guesswork just melts away. Surprise roadblocks become a thing of the past because you can spot potential conflicts weeks or even months out, giving you plenty of time to adjust the plan.
This shared view gets the whole team on the same page, working from the same script. No more conflicting priorities or people working in silos—just one clear plan that everyone understands and can follow.
Finally, Proper Team Collaboration
Good collaboration is the engine of any successful project, and that’s truer than ever with remote and hybrid teams. An online Gantt chart acts as the central hub, a single source of truth that keeps everyone in sync, no matter where they’re logging in from. Team members can see exactly how their small task connects to the bigger picture, which gives them a real sense of ownership.
Here’s an actionable step to improve collaboration today:
- Action: When you assign a task, use the comment feature to @mention the person whose work depends on it. For example, on the 'Finalise Logo' task, you could add a comment: "@SocialMediaManager, this logo will be ready for you to use in the new campaign assets by Friday." This proactive communication prevents bottlenecks before they happen.
This interconnected view stops the all-too-common "Oh, I didn't know you needed that yet" problem dead in its tracks. Instead of relying on endless status meetings and email chains, the chart becomes the main communication tool. It just makes working together smoother and way more efficient.
Get Smarter with Resource Management
One of the fastest ways to kill a project is by burning out your team. Overloading people crushes productivity and morale, but it’s often hard to spot until the damage is done. Online Gantt charts give you a clear, visual map of who is working on what and when, making it so much easier to manage workloads.
By seeing all task assignments laid out on a timeline, you can instantly spot when someone is overcommitted. This foresight lets you reallocate tasks, shift deadlines, or bring in extra help before anyone gets overwhelmed.
- Action: At the start of each week, switch to a "Workload" or "Resource" view in your Gantt software. This view typically shows each team member and their assigned tasks for the week. Look for anyone with too many overlapping bars. If you see someone is overloaded, you can drag one of their tasks to a team member with more bandwidth or reschedule it for the following week.
Smarter resource management means you can balance the load and maintain a steady, sustainable pace that keeps the project moving forward without exhausting your best people.
Start Delivering More Accurate Timelines
Building trust with clients comes down to one simple thing: delivering what you promised, when you promised it. Constantly pushing back deadlines and missing launch dates will erode that trust fast. An online Gantt chart helps you create and share realistic project timelines you can actually stick to, which is a massive advantage for any client-facing work.
- Action: Before sharing a timeline with a client, trace the "critical path" on your chart (the sequence of dependent tasks that determine the project's total length). Share a read-only link to your Gantt chart with the client and specifically point out the milestones that depend on their feedback. This educates them on how delays on their end directly impact the final delivery date, turning them into a partner in keeping the project on schedule.
Ultimately, a well-managed Gantt chart signals professionalism and control. It shows clients and stakeholders you have a solid plan, you understand the critical steps, and you’re proactively steering the project to a successful finish. That level of organisation doesn't just get the job done better; it builds the kind of lasting trust that every business needs.
A Practical Guide to Building Your First Gantt Chart
Right, let's get our hands dirty. This is your practical workshop for creating an online Gantt chart that actually works. We’ll walk through five straightforward steps that apply to almost any tool, helping you turn a blank canvas into a project plan you can rely on.
Building a Gantt chart is a bit like putting together flat-pack furniture. If you just tip all the pieces onto the floor, you're left with a confusing mess. But follow the instructions one by one, and a useful structure starts to take shape pretty quickly.
Step 1: Define Your Project Goal
Before you even think about a single task, you need a North Star. What’s the one, primary thing this project needs to achieve? Are you launching a new marketing campaign by the end of the quarter, developing a new software feature, or organising a company event?
- Action: Write your project goal using the SMART framework (Specific, Measurable, Achievable, Relevant, Time-bound). For example, instead of "Improve the website," your goal should be "Increase website conversion rates by 15% by the end of Q3 by redesigning the checkout process." Pin this goal to the top of your project workspace in your Gantt tool so the team sees it every day.
This main goal is your anchor. Every single task, milestone, and decision from here on out should directly help you get there.
Step 2: Break It Down into Tasks
With your goal set, it's time to slice that big objective into smaller, more manageable pieces. This is often called a Work Breakdown Structure (WBS), and it's absolutely vital. The idea is to create tasks small enough that they're easy to understand and assign to someone.
- Action: Hold a 30-minute brainstorming session with your team. Use a whiteboard or a digital collaboration tool to list every possible action required to reach the goal. Don't worry about order or duplicates at this stage—just capture everything. After the session, group related items into parent tasks (e.g., 'Conduct user research', 'Create wireframes', and 'Design UI mockups' can all live under a parent task called 'Design Phase'). This gives your chart a clean, hierarchical structure.
Getting this step right is fundamental. If you're using gantt charts online for something complex like a product release, it helps to cross-reference your list with a proven product launch plan sample to make sure nothing has been missed.
Step 3: Estimate Durations and Set Dependencies
Now, let's bring time into the equation. Go through your task list and estimate how long each one will take. Be realistic—whether it’s in hours or days—and always add a little buffer for surprises. It’s always better to finish early than to be late.
- Action: Instead of guessing durations, ask the person who will be doing the work for their estimate. They have the most realistic understanding of the effort involved. When setting dependencies, look for "Finish-to-Start" links first (Task B can't start until Task A finishes). Most online tools let you do this by simply dragging a connector from the end of one task bar to the beginning of another.
These links automatically map out your project's critical path—the longest chain of dependent tasks that dictates the minimum time your project will take. Any delay to a task on this path will push back your final delivery date.
Step 4: Assign Tasks to Team Members
A task without an owner is a task that will probably get forgotten. Now you need to assign every item on your list to a specific person or team. This step is all about accountability.
- Action: Go through your task list and assign an owner to every single task, even small ones. Avoid assigning tasks to a whole group like "Marketing Team." Instead, assign it to a specific person who is responsible for ensuring it gets done. If multiple people are involved, list them in the task description or comments, but keep one person as the official assignee. This clarity eliminates confusion.
Here in the Netherlands, this level of clarity is a big reason these tools are so popular. A 2022 study showed that 78% of Dutch project managers feel that online Gantt software has massively improved their team's communication and transparency.
Step 5: Set Your Milestones
Finally, it's time to mark your key milestones on the timeline. Milestones aren't tasks; they are important checkpoints that mark a major achievement or the end of a big phase. They have zero duration and usually show up as a diamond symbol on the chart.
- Action: Review your project timeline and add a milestone at the end of each major phase (e.g., 'Design Phase Complete', 'Development Phase Complete'). Also add milestones for key external events, like 'Client Sign-off Received' or 'Funding Secured'. This breaks the project into manageable chunks and creates clear points for celebration and stakeholder reporting.
These milestones act as motivational markers for the team and give you clear progress points to share with stakeholders. Many teams also find it helps to link these charts with other platforms; for instance, you can see how to use Gantt charts for Trello to merge visual timelines with your daily task boards.
How to Choose the Right Gantt Chart Software
Picking the right online Gantt chart software can feel like a chore. The market is flooded with options, and every one of them promises to be the magic bullet for your project headaches. It’s easy to get lost in feature lists and fancy demos.
But here’s the secret: you’re not looking for the tool with the most features. You’re looking for the one with the right features for how your team actually works.
Think about it like buying a vehicle. You wouldn’t get a massive lorry for your daily commute into the city centre, and you wouldn’t try to haul building supplies with a scooter. The right choice is all about your specific journey. Let's walk through how to find a tool that genuinely helps your team, instead of just adding another layer of complexity.
Start With Your Team’s Reality
Before you even open a browser tab to look at software, take a hard look at your team. How do you all work right now? What are the real sticking points in your current process? An honest self-assessment is the most important step you can take.
- Actionable First Step: Send a simple, three-question survey to your team:
- On a scale of 1-5, how easy is it to see what you need to work on next?
- What is the single biggest frustration in our current project planning process?
- Which tools (e.g., Slack, Google Drive) do you use every single day? The answers will give you a concrete checklist of problems to solve and integrations to look for.
The answers will immediately help you filter out tools that are either too simplistic or far too complicated for your needs. Remember, the goal here is adoption. If your team doesn't actually use it, even the most expensive software is a waste of money.
Core Features You Cannot Ignore
While every tool puts its own spin on things, there are a few core capabilities that are non-negotiable for any effective platform for creating gantt charts online. These are the fundamentals that make the difference between a helpful tool and a glorified spreadsheet.
Make sure any software you consider has a strong combination of these:
- An Intuitive User Interface (UI): The tool has to be easy to get around. If it takes you more than a few minutes to figure out how to add a task or set a dependency, it’s probably too clunky for daily use.
- Powerful Collaboration Features: Modern work is a team sport. Look for things like @mentions, real-time comments directly on tasks, and simple file attachments to keep all project conversations in one place.
- Essential Integrations: Your Gantt chart tool doesn’t live in a bubble. It needs to play nicely with the other software your team relies on, whether that’s Slack, Microsoft Teams, Google Workspace, or your CRM.
The market for these tools has grown substantially, even here in the Netherlands. Popular platforms like TeamGantt and Asana are now common, with TeamGantt reporting a 40% increase in Dutch users between 2021 and 2023. In fact, a recent report showed 76% of Dutch organisations said better project visibility was the main benefit they saw. You can find more data on the Gantt chart software market on their site.
Feature Checklist for Selecting Your Gantt Chart Tool
To make your evaluation easier, here's a checklist that breaks down which features are most important for different team sizes. Use this to score the tools you're looking at based on what your team actually needs today—and where you might be heading tomorrow.
| Feature | Essential for Freelancers/Solo Users | Important for Small Teams | Crucial for Large Enterprises |
|---|---|---|---|
| Task Management | ✅ | ✅ | ✅ |
| Drag-and-Drop Interface | ✅ | ✅ | ✅ |
| Task Dependencies | ✅ | ✅ | ✅ |
| Project Templates | 👍 | ✅ | ✅ |
| Real-time Collaboration | ❌ | ✅ | ✅ |
| File Attachments | 👍 | ✅ | ✅ |
| Basic Reporting | 👍 | ✅ | ✅ |
| Resource Management | ❌ | 👍 | ✅ |
| Portfolio Management | ❌ | ❌ | ✅ |
| Advanced Reporting | ❌ | 👍 | ✅ |
| Custom Workflows | ❌ | 👍 | ✅ |
| Third-Party Integrations | 👍 | ✅ | ✅ |
| User Permissions/Roles | ❌ | 👍 | ✅ |
| Dedicated Support | ❌ | 👍 | ✅ |
Ultimately, this checklist should guide you toward a tool that feels like a natural fit. A freelancer doesn't need complex user permissions, but a large enterprise absolutely does. Match the features to your reality.
Scalability and Pricing Models
Finally, think about where you're headed. The tool you pick today should be able to grow with you. A platform might seem perfect for your current team of five, but what happens when you're a team of 25 in two years? Look for features like advanced reporting, resource management, and portfolio views that you might need down the line.
While our focus here is on Gantt chart tools, it’s often smart to see how they stack up against broader project management and help desk software comparisons, particularly when you're trying to figure out the best platform for your team's overall needs.
Be careful with pricing models that punish you for growing. Per-user pricing can get expensive, fast. Some platforms offer tiered plans based on features or team size, which can be much more cost-effective as you scale up.
Don't just fixate on the monthly price tag; look at the total value. A slightly more expensive tool that saves your team hours of frustration each week is a much better investment than a cheap option that just creates more confusion. Take the time to consider the different types of software for planning to make sure you choose a solution that fits both your immediate needs and your long-term goals.
Common Questions About Online Gantt Charts
Even with all the benefits laid out, it’s normal to have a few questions before you switch up how your team works. Moving to gantt charts online can feel like a big commitment, and it’s smart to be sure. Let’s walk through some of the most common hesitations I hear from teams.
A lot of people worry that these tools are too powerful or rigid for what they need. The truth is, modern Gantt chart software is built for flexibility. You can adapt it to your workflow, whether you’re planning a massive product launch or just a small, two-week sprint.
Are Gantt Charts Too Complex for Small Projects?
Not at all. Think of a Gantt chart like a new smartphone—you don’t have to use every single app and feature to get value out of it. For smaller projects, you can just stick to the basics: a simple list of tasks, their deadlines, and a visual timeline to see how it all fits together.
- Actionable Tip: Most tools let you create project templates. For your next small project, build a simple "Quick Project" template with only three main sections: To Do, In Progress, and Done. This gives you the visual timeline without the complexity, and you can reuse it for any small job in the future.
This lets you get the main benefit—a clear visual map of the work—without getting bogged down in advanced features you simply don’t need yet.
How Do I Keep the Chart Updated Without It Becoming a Chore?
This is a big one. The secret is making the chart part of your team's natural workflow, not another piece of admin to manage.
A well-integrated online Gantt chart should feel like a natural extension of your team's communication, not a separate administrative task. The goal is to make updates happen as part of the daily conversation.
- Actionable Tip: Start every daily stand-up meeting by sharing your screen and displaying the Gantt chart. Review the tasks due today and ask for updates. By making the chart the focal point of your daily sync, team members will be more motivated to keep their tasks current because they know it will be seen by everyone.
This turns what could be a chore into a seamless part of getting things done.
Can a Gantt Chart Handle Unexpected Project Changes?
Absolutely. In fact, this is where online Gantt charts really shine, especially when compared to a static spreadsheet. A dynamic chart is built to handle the chaos of real-world projects.
- Actionable Tip: Practice a "what-if" scenario. Take a copy of a current project plan and simulate a major delay. For example, drag a key design task two weeks into the future. Watch how the dependency links automatically push back all subsequent development and testing tasks. Doing this once gives you the confidence to manage real changes because you've seen firsthand how the tool maintains the logical flow of the plan.
It’s this flexibility that keeps your plan a useful, living document that reflects reality—not an outdated wish list that nobody on the team trusts anymore.
Ready to transform your project planning with real-time data? WhatPulse provides the insights you need to understand how work actually happens, helping you optimise resources and keep projects on track. Discover how our privacy-first analytics can support your team at https://whatpulse.pro.
Start a free trial