
Yes, it's possible to get Gantt charts for Trello, but not straight out of the box. You'll need to use third-party integrations, which Trello calls Power-Ups. While Trello doesn't have a built-in Gantt feature, powerful add-ons like TeamGantt or Planyway can plug that timeline functionality directly into your boards.
Why Your Trello Board Needs a Timeline View
Trello’s Kanban board is brilliant for one thing: visualising workflow. It’s incredibly satisfying to drag a card from "To Do" to "Done." But once a project gets a bit more complex, the Kanban view starts to show its limits. You can see what needs to be done, but you lose sight of when things are happening and how they all connect.
This is where a timeline view, or Gantt chart, becomes a game-changer.
Imagine you're coordinating a marketing campaign launch. Your Kanban board has cards for "Write Ad Copy," "Design Visuals," and "Launch Campaign." Simple enough. But what the board doesn't show is that the campaign can't possibly launch until the other two cards are finished. Adding a Gantt chart gives you that crucial chronological overview.
See the Bigger Picture
A timeline view turns your Trello board from a simple task list into a proper strategic planning tool. Suddenly, you can see everything at a glance:
- Task Dependencies: It becomes obvious which tasks need to finish before others can even start. Actionable Tip: Most Power-Ups let you draw a line between two tasks to link them, automatically shifting deadlines if the first task is delayed.
- Project Milestones: You can clearly mark out key deadlines or the end of a project phase.
- Potential Bottlenecks: It’s easy to spot where a single delay could throw the entire schedule off track.
- The Critical Path: You can identify the exact sequence of tasks that dictates the project's final delivery date.
This visual layer helps your team get ahead of problems instead of just reacting to them. It’s a shift in thinking that’s catching on fast; by 2023, over 60% of Dutch digital marketing and design teams were reportedly using Trello, with Gantt chart Power-Ups being a major driver of that adoption. If you want to dive deeper into how teams are using Trello, you can find out why so many are making the switch in our full guide: https://whatpulse.pro/blog/2025-10-17-planning-a-project.
And it doesn't just stop at Trello. When you're juggling multiple projects, mastering the art of managing various calendar systems can give you an even more complete picture of your entire schedule.
By adding a timeline, you're not just managing cards on a board; you're directing the flow of your entire project from start to finish. It’s a crucial step in effective project planning and execution.
Choosing the Right Gantt Chart Power-Up
Walking into Trello's marketplace to find a Gantt chart Power-Up can feel a bit like trying to pick one tool out of a giant toolbox. There are tons of options, and the best one really depends on what you're trying to build.
A small startup might just need something simple and free to get a quick visual on their project timeline. On the other hand, if you're managing several massive projects at an enterprise level, you'll be looking for heavy-duty features like resource management, views across multiple boards, and detailed reports.
The hunt for good Gantt charts for Trello is a common one, and thankfully, the marketplace has plenty to offer.
This is where you'll find popular choices like Planyway, Placker, and TeamGantt. Each one tackles project timelines a little differently, so let's dig into what sets them apart.
Comparing Top Contenders
To help you decide, here’s a look at some of the most popular choices and who they’re best for.
Planyway: This is a fantastic all-rounder. Its multi-board view is a lifesaver for managers juggling several projects at once. With a simple drag-and-drop interface and solid resource planning features, it strikes a great balance between power and ease of use.
Placker: If you live by the numbers, Placker is your tool. It goes way beyond just a timeline, offering deep reporting and progress tracking. It’s perfect for project managers who need to keep stakeholders in the loop with detailed analytics.
TeamGantt: Known for its clean, classic Gantt chart feel, this Power-Up is a crowd favourite. A big part of its appeal is the free plan, which makes it incredibly accessible.
In fact, that free plan has made the TeamGantt Power-Up especially popular in the Netherlands, attracting 70% of Dutch users. It gives small and midsize teams a way to visualise their schedules without a big upfront cost. We've seen this drive adoption in newer sectors, like the renewable energy startups popping up in Amsterdam and Utrecht.
The real goal isn't to find the tool with the longest feature list. It's to find the one that fits so well into your team's workflow that they actually want to use it every day.
As you explore different Power-Ups, you might also want to look at dedicated tools like the Taskignite application. For really complex projects, an external, specialised tool can sometimes offer more muscle than a simple Trello integration. It all comes down to what your team truly needs.
Comparison of Popular Trello Gantt Chart Power-Ups
To give you a clearer picture, here’s a side-by-side look at some of the top contenders. This table breaks down what each Power-Up does best, so you can quickly see which one aligns with your team's priorities and budget.
| Power-Up | Best For | Key Features | Free Plan Availability |
|---|---|---|---|
| Planyway | Teams needing an all-in-one timeline and resource planner. | Multi-board views, resource management, time tracking. | Yes, with limitations. |
| Placker | Data-driven teams that require robust reporting and tracking. | Dashboards, progress reports, mirrored cards. | Yes, limited to one board. |
| TeamGantt | Teams looking for a traditional, user-friendly Gantt chart. | Drag-and-drop dependencies, workload view, clean interface. | Yes, for up to 3 users and 1 project. |
Ultimately, the best choice depends on your specific context. A small team might find everything they need in TeamGantt's free plan, while a larger organisation will likely get more value from Placker's advanced analytics. Take a moment to think about your must-have features before you decide.
Setting Up Your First Trello Gantt Chart
Once you've settled on the right tool, the next step is connecting it to your Trello board. This is usually pretty straightforward. For this walkthrough, we’ll use Planyway as our example, mainly because it's a popular choice and easy to get started with. The basic steps are quite similar no matter which Power-Up you choose.
Your first move is to grab the Power-Up from the Trello marketplace.
- Navigate to your Trello board.
- Click the Power-Ups button in the top menu (it might be under the "..." menu).
- In the search bar, type "Planyway".
- When you see it, click the green "Add" button.
Trello will pop up a request for authorisation. This part is essential—it lets the Power-Up read your board's data, like cards, members, and due dates, so it can sync everything into the Gantt chart view. This is how the magic happens, giving you a live, visual timeline of your project.
Completing the Initial Setup
With permissions sorted, the Power-Up is now active. Planyway typically opens a new timeline view right next to your usual Kanban board. It might look a bit empty at first, but that's because it's waiting for you to map your Trello card details onto the timeline.
This is the most critical part of setting up gantt charts for trello. The chart is only as good as the information on your cards.
- Assign Start and Due Dates: Every task needs a timeframe. Make sure any card you want to see on the timeline has both a start date and a due date.
- Add Members to Cards: Assigning team members to cards helps you see who's responsible for what at a glance, which is a game-changer for resource planning.
The accuracy of your Gantt chart is directly tied to the quality of the data on your Trello cards. Consistent use of due dates, members, and labels will create a far more powerful and reliable project timeline.
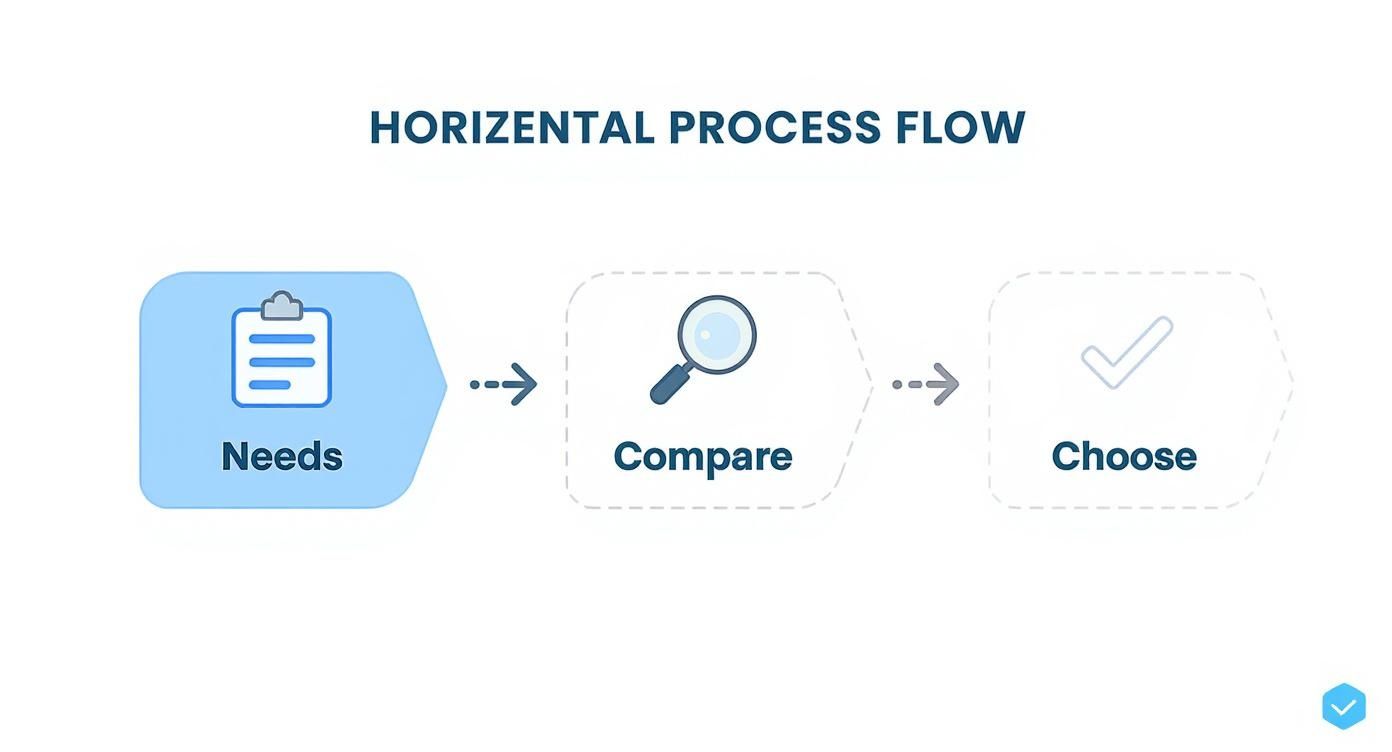
This simple process flow—assessing your needs, comparing options, and then making a choice—is what it all boils down to.
As you can see, picking a tool is a strategic move, not just a random click. If you’re dealing with a bigger project that needs serious task breakdowns before you can even think about scheduling, you might want to learn how to build a solid foundation with these work breakdown structure examples for project management.
Now, you can just drag and drop your cards onto the Planyway timeline to schedule them. You’ll see your project take shape visually in just a few minutes.
Customising Your Timeline for Maximum Clarity
A standard timeline is a good starting point, but a customised one is where you really start to take control of your project. When you tailor your Gantt chart to fit your project's unique needs, it stops being a simple schedule and becomes a powerful planning tool. You're basically building a visual language that your entire team can understand at a glance.
This goes way beyond just plotting start and end dates. The first, most practical step is to set task dependencies. This creates a logical flow where one task can’t begin until another is finished, which is exactly how things work in the real world. For example, the "Launch Social Media Campaign" task can't kick off until "Finalise Ad Creatives" is ticked off.
From there, you’ll want to establish project milestones. These aren't your day-to-day tasks; they're the big checkpoints, like "Beta Version Deployed" or "Q3 Marketing Review Complete." Marking these on your timeline gives everyone a clear view of key achievements, which does wonders for keeping morale and momentum high.
Visual Organisation Techniques
Colour-coding is probably one of the most effective ways to add another layer of clarity. By assigning specific colours to different phases, teams, or priorities, you can see what's going on without having to read a single word.
- By Team: Assign blue to the development team, green to marketing, and orange to sales. This makes it instantly obvious who is responsible for what.
- By Phase: Use shades of one colour to show progress. You could use light grey for planning, medium grey for execution, and dark grey for the final review.
- By Priority: Make high-priority tasks red and lower-priority ones yellow. This naturally draws everyone's attention to what's most urgent.
The real goal here is to create a visual plan that communicates complex information with a simple glance. A well-customised Gantt chart helps you see delays before they happen and improves communication, turning your Trello board into a proper strategic asset.
This approach has paid off in all sorts of industries. For instance, Dutch manufacturing teams have found that using gantt charts for trello helps them streamline scheduling and resource management. The result? They've seen project overruns drop by around 20% year on year. You can learn more about how Dutch teams are leveraging these tools to boost their efficiency.
Advanced Tips for Project Management
Once you’ve got the hang of creating basic timelines, it's time to unlock what your gantt charts for trello can really do. When you move past simple scheduling, your board stops being just a task list and starts becoming a proper command centre for managing complex projects.
A powerful next step is using the timeline view for proactive resource management. When you can see everyone’s tasks laid out visually on the Gantt chart, you’ll immediately spot when a team member is over-allocated. This lets you rebalance workloads before burnout becomes a problem, keeping the whole team on a sustainable pace.
Mastering High-Level Overviews
For managers juggling multiple projects, creating a portfolio view is a total game-changer. Most advanced Power-Ups let you pull several Trello boards into a single, master Gantt chart. This gives you that high-level overview of everything the company is working on, helping you prioritise resources and spot any cross-project dependencies you might have missed.
A master Gantt chart gives you a bird's-eye view, turning scattered project data into a cohesive strategic roadmap. It’s the key to understanding how individual projects contribute to broader company goals.
Another crucial advanced feature is generating and sharing progress reports straight from your Gantt chart tool. Instead of spending time manually pulling together updates, you can export a clean, visual report for stakeholders with just a few clicks. It keeps everyone in the loop without adding to your admin pile.
This approach also ties directly into better resource planning. When you visualise where everyone's effort is going, it becomes much clearer where time is actually being spent. For a deeper look at this, check out our guide on tracking time spent on projects, which can help you refine your resource allocation even further. These advanced strategies ensure your projects don't just stay on track—they run as efficiently as possible.
Got Questions About Trello Gantt Charts?
Whenever you plug a new tool into your workflow, a few questions always pop up. Let's run through some of the most common ones I hear about gantt charts for trello so you can get started with confidence.
Is My Data Safe with a Power-Up?
This is usually the first thing people ask, and for good reason. A Gantt chart Power-Up needs access to your Trello boards to work its magic. The good news is that reputable tools operate under strict privacy policies, many of them aligned with GDPR, to make sure your project data is handled securely.
My advice? Always take a minute to review a Power-Up's permissions and privacy statement before you hit "authorise". It’s a small step that gives you peace of mind.
What if My Board Is Huge?
Another common worry is performance. What happens if your board has hundreds, or even thousands, of cards? A powerful Gantt chart can sometimes lag a bit on exceptionally large boards. It’s a lot of data to process, after all.
To get around this, a lot of teams I've worked with make a habit of archiving completed cards. Another great trick is to split massive projects across a few smaller, more focused boards. This keeps things zippy and ensures the Power-Up runs smoothly.
How Do We Actually Collaborate with This Thing?
This is a big one. How do you make sure the Gantt chart becomes a shared resource for the whole team, not just another dashboard for the project manager to stare at?
The trick is to make the timeline the single source of truth for scheduling. Get your team into the habit of updating their card due dates directly in Trello as they work. Since the Gantt chart syncs this data automatically, everyone sees the most current timeline without any extra steps.
It's a classic mistake to have one person "own" the Gantt chart in isolation. For it to really work, you need to treat it as a living, breathing space where the entire team chips in to keep the project timeline honest.
Ready to get a real handle on your team's workflow and project timelines? WhatPulse gives you the privacy-first analytics you need to see how work actually gets done. Start making data-driven decisions today.
Start a free trial