

That monthly invoice for your big-name software is just the start. The real cost of your cloud app spend is the total of every software-as-a-service (SaaS) subscription active in your company. It’s the main CRM, but it’s also every niche tool used by a single department, quietly growing through automatic renewals and forgotten licenses.
Why Your Cloud App Spend Is Higher Than You Think
Most companies are surprised when they add up their actual cloud application costs. It’s easy to underestimate because the focus is usually on the most obvious expenses. The true cost is a mix of direct payments, hidden waste, and lost productivity.
IT and Finance teams need to be on the same page. Finance sees the direct debits, but IT understands the technical mess of duplicate tools and their security risks. Without a shared view, neither department has the full financial picture.
The Hidden Costs You Are Missing
The easy-to-spot costs are monthly or annual fees for software like Microsoft 365 or Salesforce. The real budget drain comes from harder-to-see sources.
- Automatic Renewals: Many tools are bought for a one-off project but then renew automatically, unnoticed, for years.
- Forgotten Licenses: When someone leaves the company, their software licenses are often overlooked. These "zombie" accounts become pure waste.
- Overlapping Functionality: Different departments often buy separate tools that do the same thing. You might be paying for three project management apps or two file-sharing services. This creates unnecessary expense.
It's not a small leak. One study found that organisations waste up to 30% of their software spend on licenses that are unused or barely touched.
More Than Just a Financial Drain
Uncontrolled cloud app spend isn't just a number on a spreadsheet; it creates friction. When employees have too many tools, it leads to confusion and inefficiency. Data gets scattered across different platforms, making collaboration difficult and creating information silos. This operational drag is a huge, hidden productivity cost.
The goal is to build a complete, accurate picture of your application landscape. Once you understand what you're spending on software—and why—you can manage it properly instead of just reacting to surprise invoices.
The Metrics You Need to Track Cloud Spend
You can't control what you don't measure. Getting a clear view of your cloud app landscape starts with tracking the right things. Looking at invoices isn't enough; you need to dig into how the software is actually being used.
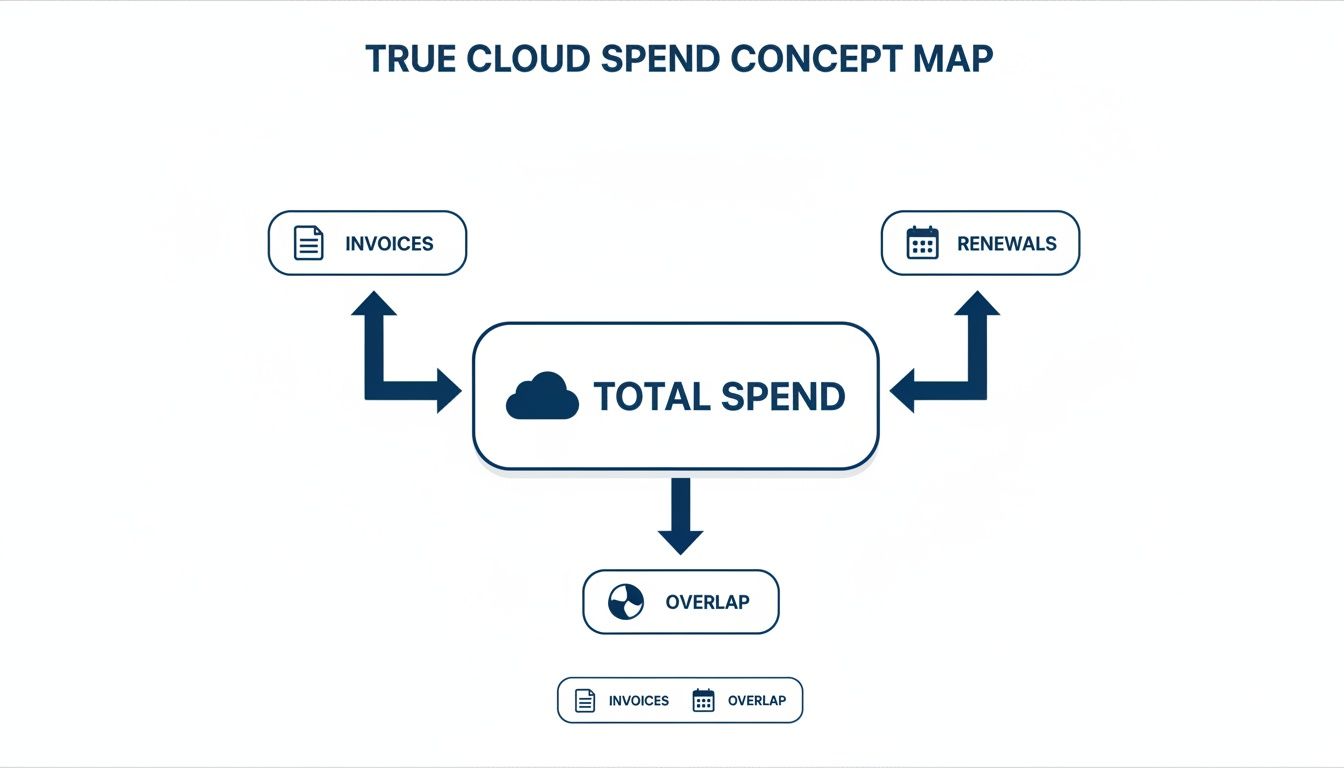
As the diagram shows, your real costs are a mix of obvious payments and hidden factors like renewal cycles and redundant tools.
This kind of scrutiny is becoming more common. Across the Netherlands, organisations are tightening IT spending. A recent study found that just 37% plan to increase their IT budgets in the next two years, while 20% are actively looking for ways to cut back. This pressure makes a firm grip on application spend necessary. You can learn more about this trend in Dutch IT spending on Mordor Intelligence.
To get started, look beyond the total cost on an invoice. Focus on a few metrics that show the true story of your software spend.
Here is a summary of what to track.
| Metric | What It Measures | Why It Matters |
|---|---|---|
| Licence Utilisation | The percentage of paid licences actively used by employees. | Shows direct financial waste from over-provisioning or poor offboarding. |
| Active vs. Idle Users | The difference between users with assigned licences and those with meaningful activity. | Uncovers "zombie" accounts that cost money without providing value. |
| Application Overlap | The number of paid tools that perform the same core function. | Reveals chances for consolidation and savings. |
| Shadow IT Spend | Unapproved software bought and used by employees without IT oversight. | Exposes hidden costs, security vulnerabilities, and compliance risks like GDPR gaps. |
Licence Utilisation
This is the most direct metric. Licence utilisation is the percentage of purchased software seats in active use. If you pay for 100 licences for a project management tool but only 70 employees have logged in this quarter, your utilisation rate is 70%.
That leftover 30% is pure financial waste. It often happens when teams over-provision for a new project or when licences aren't reassigned after employees change roles. Our software licence cost calculator can help you estimate what those unused seats cost.
Active vs Idle Users
Next, separate your active users from the idle ones. An employee might have a licence and have logged in once three months ago, but that doesn't mean they are using the tool.
An idle user is someone with a licence who shows no meaningful activity over a set period, like 30 or 90 days. Identifying these accounts allows for precise cost-cutting. You can downgrade these users to a free tier or revoke their access, freeing up a licence for someone who needs it.
Application Overlap
Application overlap happens when your company pays for multiple cloud apps that do the same thing. This is common in larger organisations where departments make purchasing decisions independently.
For example, the marketing team might use Asana, while the engineering team uses Jira, and a small project group is on Trello. All are project management tools. Paying for all three is a sign of inefficiency that could be solved by moving to a single platform.
Shadow IT Spend
Finally, there’s shadow IT. This is any software used by employees without official approval from the IT department. These apps are often bought on personal or team credit cards and expensed later, flying under the radar of traditional procurement.
Shadow IT is not just a financial risk; it is a major security vulnerability. These unvetted applications may not comply with data protection standards like GDPR, creating a serious compliance gap.
Tracking these metrics isn't a one-off task. It requires a systematic approach, combining data from procurement records, user access logs, and endpoint analytics to build a complete picture of your cloud spend.
How to Attribute Application Spend Accurately
Once you know which metrics to track, the next step is getting reliable numbers. Attributing your cloud app spend means connecting the costs to the specific teams, projects, or departments that use the software. Many companies get stuck here, often relying on guesswork or outdated spreadsheets.
Without accurate attribution, you can’t have honest conversations about budgets. It’s impossible to hold a department accountable for its software consumption if you can't show them the data. The goal is to move from a single, central IT budget to a model where business units see—and own—their part of the total spend.
Methods for Measuring Usage
There are three common ways to track application use. Each offers a different level of detail and requires a different amount of effort. Your choice will depend on your company’s size and technical resources.
- Endpoint Usage Data: This method gathers data directly from employee computers. Lightweight agents track which applications are running and for how long, giving you a ground-truth view of what’s actually being used. This approach offers the highest accuracy.
- Network Telemetry: By analyzing traffic patterns on your company network, you can see data flowing to and from specific cloud services. This is useful for tracking web-based applications, but it can be less precise in attributing usage to individual users without extra configuration.
- Billing Reconciliation: This is the most common and most manual method. It involves cross-referencing software invoices with HR lists and team rosters. While it doesn't require special tools, it's time-consuming, prone to error, and often misses inactive accounts that are still being paid for.
Choosing Your Approach
Billing reconciliation is a starting point, but it rarely gives you the complete picture. It tells you who has a licence, not who is using it. Network telemetry adds another layer but can be complex to implement correctly.
For a truly accurate view of your cloud app landscape, endpoint data is the most direct source of truth. It answers the question: Is this software helping someone do their job, or is it just costing us money?
Using tags and filters makes this data more powerful. Check out our guide on filtering application data using tags to see how you can assign software costs directly to specific projects or departments. This level of detail turns spend management from a reactive chore into a strategic advantage.
Actionable Strategies for Optimising Cloud Spend
Good data is just the starting point. It shows you where the money is going, but it doesn't cut costs on its own. You have to use those insights to make changes. Once you have a clear picture of what's being used and by whom, you can shift from just paying bills to actively managing your cloud app portfolio.
These strategies are practical ways for any organisation to get a better return on its software investment.

This proactive approach matters in a competitive market. Here in the Netherlands, public cloud adoption is high, with 84% of organisations planning to either expand or maintain their usage. Dutch firms also rank in the top five globally for cloud spend as a percentage of their total IT budget.
With 52.3% of Dutch enterprises reliant on sophisticated cloud services, unchecked app sprawl can inflate costs fast.
Rightsizing Your Licences
Rightsizing means matching each employee's software licence to what they actually need. Not everyone requires the top-tier "Enterprise" or "Pro" version of an application. Many people can do their jobs with a "Standard" or free version.
- Look at usage patterns: Find users who only touch the basic features of a premium tool.
- Talk to managers: Before downgrading anyone, check with their team lead. You want to save money, not impede their work.
- Make the switch: Move those users to a lower-cost tier. This one action can lead to large savings, especially across large teams.
This isn't about taking tools away from people. It's about paying for what you use. You can dive deeper into this idea in our guide on optimizing software licences.
Consolidating Overlapping Tools
Application overlap is a common money pit. It happens when different departments independently sign up for tools that do the same thing, leading to redundant subscriptions.
Imagine your marketing team uses Asana, your developers are in Jira, and a project group is using Trello. You're paying for three project management tools. Standardising on one cuts costs and makes it easier for teams to work together in the same system.
The first step is to identify all apps in a single category, like project management or file sharing. Then, get the teams who use them to evaluate the options and agree on a standard tool for the whole organisation.
Enforcing Clear Access Policies
Without rules for who gets a software licence, costs can spiral. A well-defined access policy ensures licences only go to employees with a genuine business need.
This means setting clear criteria for provisioning an account. For example, a licence for a specialised design tool should only go to members of the creative team. A simple request-and-approval process, managed by IT, stops unnecessary assignments and keeps costs predictable. Good expense management software can help streamline that financial oversight.
Automating Deprovisioning
A big leak in any software budget comes from "zombie accounts." These are licences still assigned to former employees that were never deactivated. Companies end up paying for these empty seats month after month.
Automating the deprovisioning process plugs this leak. By linking your HR system to your IT management tools, an employee's access to all company software is automatically cut off on their last day.
This instantly stops the financial drain from forgotten accounts and tightens security by removing old access points. It turns a manual, error-prone chore into a reliable, automated workflow.
Using Privacy-First Analytics to Gain Control
Old ways of tracking your cloud app spend don't work well anymore. They’re often intrusive, looking into employee content, or they miss the mark by relying on flawed self-reporting or manual invoice checks. A better way is using privacy-first endpoint analytics to get the data you need without crossing ethical lines.
This approach looks at metadata, not content. By gathering data on application uptime, keyboard and mouse activity, and network traffic, you can see which software licences are essential and which are collecting dust. There is no need to know what someone is typing, only that they are actively using the application.
This means your financial decisions can be based on facts, not guesswork.
Seeing What’s Actually Used
Tools built on this privacy-first model, like WhatPulse, give you a clear view of your software environment. You can see which apps are running, who is using them, and for how long. This isn't an estimate; it's a direct reflection of what’s happening on company devices.
- Find Unused Software: Quickly pinpoint licences assigned to employees who never open the application.
- Monitor Software Versions: Ensure everyone is on the correct, secure version of a tool, which reduces support tickets and security risks.
- Track Tool Adoption: See if a new platform you rolled out is being used by the teams you bought it for.
This is what that clarity looks like. The WhatPulse Professional dashboard lets IT managers see real-time application usage across the organisation.

Metrics like application uptime and active users are right on the screen, making it simple to spot underutilised software.
Maintaining Trust and Compliance
This approach respects employee privacy while delivering powerful insights. Because the system aggregates anonymous activity metrics—not keystrokes or screen content—it stays compliant with data protection regulations like GDPR.
Employee data remains secure and private. The focus is on how tools are used, not what employees are creating with them. This builds trust and ensures your optimisation efforts don't feel like surveillance.
This method gives IT and finance teams the evidence they need to challenge software renewals, reallocate licences, and consolidate overlapping applications. You’re no longer relying on a department manager’s guess. Instead, you have objective data showing what’s providing value.
Common Questions About Cloud App Spend
Here are a few common issues teams run into when trying to sort out their SaaS subscriptions.
Where Do I Start With Finding All Our Apps?
The first step is to compile a complete list of every SaaS tool your company is using.
Start by looking at procurement records and credit card statements for officially paid subscriptions. Then, survey your teams to uncover the shadow IT and niche apps bought outside of normal channels.
Finally, confirm what's actually being used. Endpoint analytics tools like WhatPulse can show you which apps are running on company devices.
- Pull purchase data from your finance systems.
- Scan your endpoints to see which cloud apps are installed.
- Talk to department heads to find one-off tools.
- Check renewal dates in vendor portals to prevent surprise charges.
This inventory should be a living document, updated whenever someone joins or leaves.
How Often Should We Review SaaS Licences?
For most companies, a quarterly audit is a good balance.
This is frequent enough to catch unused licences before they auto-renew, but not so often it becomes a burden. For big, expensive enterprise subscriptions, check in monthly.
Put these reviews on a shared calendar for both finance and IT.
Expert Insight: Regular licence audits can cut cloud app costs by as much as 25% a year. It's one of the highest-impact activities you can do.
Try to align audit dates with billing cycles so you can adjust user counts before the next invoice. Keep a simple dashboard showing licence use, idle seats, and upcoming renewal dates.
- Check user activity logs to find quiet accounts.
- Confirm contract terms and notice periods.
- Store metrics in a tool like WhatPulse to track trends.
When you're done, share the results with department heads to build shared responsibility for the budget.
How Can We Cut Costs Without Hurting Productivity?
The goal is to cut waste, not essential tools. This is about making smarter, data-driven decisions.
Start by looking at usage patterns. Do you have team members on a premium licence when they only use basic features? Moving them to a lower tier is an easy win.
- Identify idle seats with endpoint analytics from WhatPulse.
- Test any tool consolidation with a small group before a company-wide rollout.
- Give people training and a clear timeline to make the transition smooth.
Track progress on a live dashboard. Are people adopting the new tool? Is licence utilisation going up?
Key: Phased changes are more effective. They keep teams on board and give you a chance to fix issues before they become company-wide problems.
After each phase, gather feedback to catch problems early. Set clear KPIs, like your licence utilisation rate, to measure success. This approach ensures you’re cutting fat, not muscle.
Ready to get a handle on your cloud app spend? Sign up for WhatPulse and start using privacy-first endpoint analytics. You’ll get the data you need to control costs and see exactly what’s happening across your teams.
Start a free trial