

When you hear people talk about cycle time vs lead time, it's easy to get them mixed up. They sound similar, but they're measuring two very different things from two completely different points of view.
The simplest way to think about it is this: Lead Time is what your customer experiences, from the moment they ask for something to the moment they get it. Cycle Time is what your team experiences—the time it takes to actually do the work once they've started.
Foundations of Workflow Metrics
Getting this distinction right is the first real step toward making your team's workflow more predictable and efficient. One metric tells you about your customer's wait, while the other gives you a window into your team's production speed.
It’s a common trap to confuse the two, which often leads to solving the wrong problems. I've seen teams work incredibly hard to shave a day or two off their cycle time, making their internal process faster, while completely overlooking the fact that requests were sitting in a backlog for weeks. The result? They got faster at doing the work, but the customer didn't feel any difference.
Defining the Core Concepts
To diagnose what’s really going on in your workflow, you need to be crystal clear on what each metric represents.
- Lead Time: This is the total time that passes from the moment a request is made until it’s delivered to the customer or stakeholder. It covers everything—the waiting, the approvals, the discussions, and the actual work. It’s the full journey from your customer's perspective.
- Cycle Time: This is just one piece of the lead time puzzle. It measures the time from when your team actively starts working on a task to when they finish it. Think of it as the “hands-on” production phase.
The most common mistake is optimising for cycle time alone. A fast cycle time doesn't matter to a customer if their request sat in a queue for weeks first. Lead time always tells the truer story of your delivery speed.
A Quick Comparison
It's helpful to remember the difference between tracking vs measuring. Lead time is a measurement of the entire customer experience. Cycle time, on the other hand, helps you track the efficiency of a specific part of that experience.
To give you a clearer view of cycle time vs lead time, here’s a table that breaks down their core differences at a glance.
Key Differences Between Lead Time and Cycle Time
| Attribute | Lead Time | Cycle Time |
|---|---|---|
| Perspective | External (Customer-focused) | Internal (Team-focused) |
| Start Point | When a request is made | When active work begins |
| End Point | When the request is delivered | When active work is completed |
| What It Includes | Waiting time + active work time | Only active work time |
| Primary Purpose | Measures customer satisfaction | Measures process efficiency |
Ultimately, both metrics are valuable, but they serve different functions. Lead time helps you understand your relationship with your customers, while cycle time helps you pinpoint bottlenecks and improve your internal processes.
How These Metrics Reveal Workflow Bottlenecks
Knowing the definitions is a start, but the real magic happens when you see how cycle time and lead time interact. They aren't two separate metrics; they're deeply connected. Lead time covers the entire journey from request to delivery, which means it always includes cycle time plus all the waiting around that happens before the real work begins.
This relationship is where you'll find your biggest opportunities for improvement. The time a task spends gathering dust in a backlog, waiting for an approval, or queued up for the next deployment is just as much a part of the customer's experience as the time your team is actively coding. The gap between these two numbers is a flashing sign pointing directly at your hidden inefficiencies.
The diagram below lays out the entire flow, showing exactly where lead time starts and how cycle time fits inside it.
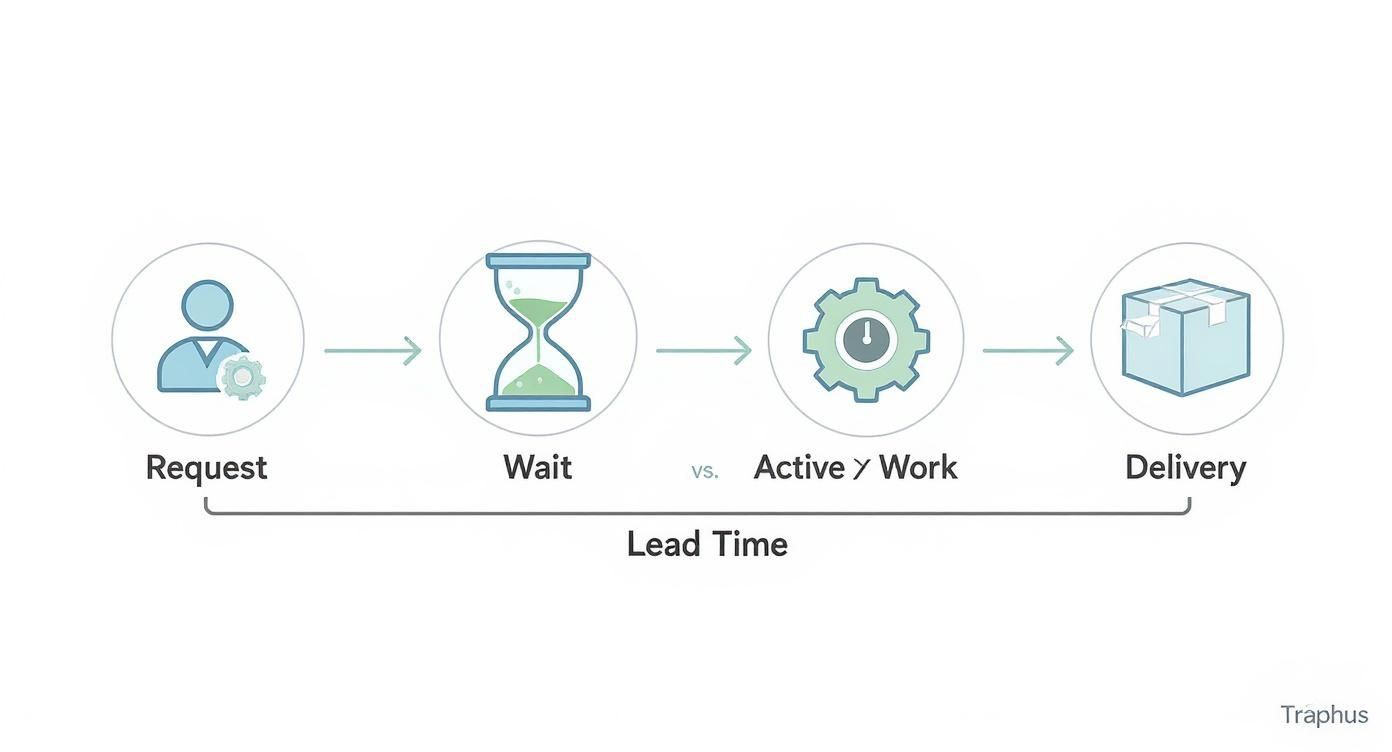
It’s clear from this visual that the "Wait" phase is a huge part of lead time but has nothing to do with cycle time. This is where most bottlenecks live.
A Practical Software Development Scenario
Let's walk through a common software development situation to see how these metrics pinpoint completely different problems. Imagine a customer requests a new feature on the 1st of April.
- Request Made (Lead Time Starts): 1st April. The idea lands in the product backlog.
- Work Begins (Cycle Time Starts): 15th April. After two weeks of backlog grooming and sprint planning, a developer finally pulls the task into "In Progress."
- Work Completed (Cycle Time Ends): 25th April. The feature is coded, tested, and merged. This took ten days of hands-on work.
- Delivered to Customer (Lead Time Ends): 27th April. The feature goes live after waiting two days for the scheduled deployment slot.
So, what happened here? The cycle time was 10 days. This number tells you how efficient the active development process was. But the lead time was a whopping 27 days—the total time the customer was left waiting.
When your lead time is long but your cycle time is short, it’s a massive red flag. The problem isn’t slow developers; it’s a slow process.
The difference between the two numbers instantly shows you where the real drag is. The team wasn't slow; the workflow was. That feature sat idle for 14 days in the backlog and another 2 days waiting to be deployed. That's 16 days of dead time, far more than the 10 days of actual work. Without tracking both metrics, the team might have focused on coding faster, completely missing the much larger issue.
Dissecting Lead Time to Find Bottlenecks
Think of the gap between lead time and cycle time as your treasure map for finding workflow waste. It’s made up entirely of "wait states"—all the periods where a task is just sitting there. By breaking down lead time, you can find exactly where things get stuck.
Actionable Step: Create a simple spreadsheet or use your project management tool to track the time a task spends in each 'wait' status. Over a month, calculate the average time for each state. The one with the highest average is your biggest bottleneck and your top priority for improvement.
Common wait states that blow up lead time (but don't affect cycle time) include:
- Backlog Time: How long a ticket sits in the "To Do" column before anyone touches it.
- Approval Queues: The time spent waiting for a sign-off from a manager, the security team, or other departments.
- Resource Unavailability: Delays caused by waiting for a specific person or piece of equipment to become free.
- Deployment Queues: The limbo period after development is done but before the work is actually shipped to the customer.
By identifying and measuring these wait states, you can stop guessing where the problems are and start knowing. Is your backlog a black hole? Are approvals taking forever? Answering these questions is the first real step toward shortening your lead time, making your delivery dates more predictable, and getting value to your customers much, much faster.
Measuring and Analysing Your Workflow Metrics
Knowing the difference between cycle time and lead time is the first step. The real challenge is measuring them accurately so you can move from theory to actual improvement. You need real data from your workflow, but thankfully, the calculations are straightforward and give you a solid place to start your analysis.

At their core, the formulas are just about timestamps. Lead time captures the entire journey from the customer's perspective, while cycle time zooms in on the active work phase.
- Lead Time Formula: Time of Delivery – Time of Request
- Cycle Time Formula: Work End Date – Work Start Date
These two simple formulas are all you need to get the raw numbers and start asking much more interesting questions about your process.
Applying the Formulas in Practice
Let’s walk through a real-world example. Imagine a software development team gets a bug report logged in a tool like Jira.
- Request Received (Lead Time Starts): A user reports a bug, and a ticket is created on 1 June.
- Work Begins (Cycle Time Starts): A developer pulls the ticket from the backlog into the "In Progress" column on 5 June.
- Work Finishes (Cycle Time Ends): The developer finishes the fix and moves the ticket to "Done" on 10 June.
- Delivered to User (Lead Time Ends): The fix is pushed to the live environment on 12 June.
Running the numbers:
- Lead Time = 12 June – 1 June = 11 days
- Cycle Time = 10 June – 5 June = 5 days
Straight away, you can see the task spent 6 days waiting around—more time than the 5 days it was actively being worked on.
The goal isn't just to measure but to interpret. A significant gap between your lead time and cycle time is a direct indicator of process waste—time lost in queues, handoffs, or waiting for deployment.
Visualising Metrics with Kanban Boards
This is where Kanban boards really shine. Most modern project management tools like Jira, Azure DevOps, and Trello can automatically track the "time in column" for every task. This feature provides a constant, visual stream of data showing exactly how long work is sitting in each stage of your process.
Actionable Step: Configure your Kanban board to automatically generate a Cumulative Flow Diagram (CFD). This chart shows the quantity of work in each stage over time. Look for bands that are widening—this visually indicates a bottleneck where work is piling up faster than it's being completed.
If you set up your board to mirror your actual workflow—for example, "Backlog," "In Progress," "Code Review," "Testing," and "Ready for Deployment"—you can instantly spot where things are grinding to a halt. Your board becomes a dynamic diagnostic tool, not just a task manager, making bottlenecks impossible to miss. Learning to spot these issues is central to understanding how to measure operational efficiency effectively.
Moving to Deeper Analysis
Once you have a baseline, you need to look beyond simple averages. Averages can be deceptive; they hide the swings. A team that consistently delivers in 10 days is far more predictable than a team whose average is also 10 days but ranges from two to thirty.
A scatter plot diagram is one of the best tools for understanding this variability. Each dot on the plot represents a finished task, showing its completion date on one axis and the time it took on the other. This gives you a powerful visual that helps you:
- Identify Outliers: Instantly see which tasks took way longer than everything else.
- Understand Predictability: Look at how tightly the dots are clustered to see how consistent your delivery times really are.
- Set Realistic Expectations: You can draw percentile lines to make data-driven forecasts, like, "85% of our tasks are completed in 12 days or less."
When you start using analysis techniques like these, you stop just measuring your workflow and start actively improving its reliability. The insights you get from turning raw data into actionable decisions are what truly build a more efficient, predictable process.
Real-World Impact on Dutch Manufacturing Efficiency
While software development offers some great examples, the real story of cycle time vs lead time began on the factory floor. It’s where these metrics still hold immense weight, especially in the highly competitive Dutch manufacturing sector. This isn’t just some academic debate; getting this right directly shapes profitability, customer happiness, and your place in the market.
It's common to see a huge gap between a quick production cycle and a painfully long lead time. This gap almost always points to problems that have nothing to do with what’s happening on the assembly line. The time a product is actually being built (cycle time) is often just a small slice of the total time a customer waits for their delivery (lead time).
The rest of that waiting period gets eaten up by everything else: administrative hold-ups, queues waiting for the next machine, quality checks, and final shipping. It’s a classic case of focusing on making the machines run faster while ignoring the biggest sources of delay.
The Hidden Costs of Waiting
For many Dutch companies, the biggest efficiency gains aren’t found in tweaking machinery, but in untangling the entire process from order to delivery. When lead times are long but your production cycle is short, it’s a clear sign of systemic issues in how work is managed and planned.
This isn't just about a harmless delay. It creates real business problems:
- Losing to the Competition: If a competitor can deliver faster, they’ll often win the order, even if your quality is identical.
- Bloated Inventory Costs: Longer processes mean more unfinished products (WIP) and finished goods just sitting around, tying up cash that could be used elsewhere.
- Unreliable Forecasting: When lead times are all over the place, it’s impossible to give customers a delivery date you can stand by, which chips away at trust.
The challenge isn’t just to make things faster. It’s to cut down the time things spend doing absolutely nothing. That's where you find real efficiency.
A Dutch Electronics Case Study
This isn’t just theory. A study at a Dutch electronics manufacturer put this problem into sharp focus. They discovered the average lead time for a printed circuit board assembly (PCBA) was five weeks. That sounds long, but the actual production cycle was a tiny fraction of that. The automated assembly process had a cycle time of just 4 working days, and even the manual process took only 14 working days. You can read more about these findings on process efficiency.
So, where did the rest of the time go? More than 60% of the total lead time was lost to waiting—waiting for parts, waiting for inspections, and waiting in administrative queues. The data was crystal clear: the biggest bottlenecks were in the office and the warehouse, not on the factory floor.
By looking at both cycle and lead time, Dutch manufacturers can shift their attention from simply making the line faster to improving the whole journey, end to end. This is how you end up with delivery promises you can keep, lower operating costs, and a much stronger position in a tough global market.
How To Actually Reduce Your Cycle And Lead Times
Knowing the difference between cycle time and lead time is a great first step. But real improvement only comes from action. The goal is to shrink both metrics by tackling inefficiencies in the active work phase (cycle time) and the often-overlooked waiting periods (lead time). Just telling your team to "work faster" is almost never the answer.

Truly effective strategies focus on one thing: eliminating waste. By adopting a few proven techniques, you can see huge reductions in both metrics, which leads to more predictable delivery and, ultimately, happier customers.
Techniques For Shortening Cycle Time
Cutting down your cycle time is all about making the "active work" phase more efficient. This isn't about rushing your team; it's about removing the friction that slows them down.
- Automate Everything Repetitive: Actionable Step: Identify the top three most time-consuming manual tasks in your workflow (e.g., running tests, deploying to staging). Dedicate one "sprint" or work cycle to automating at least one of them.
- Try Pair Programming: When two developers tackle a single task together, they tend to catch errors faster and produce higher-quality code from the start. This collaborative approach often reduces the need for long, drawn-out code reviews down the line.
- Standardise Your Development Environment: Actionable Step: Use tools like Docker or Devcontainers to create a single, version-controlled development environment. New team members should be able to get a fully working setup in under an hour.
The biggest wins in cycle time come from system improvements, not from asking people to work harder. A well-oiled CI/CD pipeline delivers more consistent speed than a developer pulling an all-nighter ever will.
Strategies For Reducing Lead Time
Shrinking lead time means looking at the entire value stream, especially the time when work is just sitting around. This is usually where you'll find the biggest and easiest gains.
- Set Strict Work-in-Progress (WIP) Limits: Actionable Step: Start with a WIP limit equal to the number of people on your team. Apply this limit to your "In Progress" column. Do not start new work until an existing task is completed. This will feel uncomfortable at first, but it works.
- Get Serious About Backlog Grooming: A messy, disorganised backlog is a huge source of delay. Regular grooming sessions ensure that tasks are clearly defined, properly prioritised, and genuinely ready for development before anyone even touches them.
- Attack Your Approval Stages: Go through every single approval gate in your process and ask if it's really necessary. If an approval is essential, define clear Service Level Agreements (SLAs) so work doesn't get stuck waiting in someone's inbox for days.
Case Study: A Dutch Tech Firm's Turnaround
A technology firm in the Netherlands was struggling with wildly unpredictable delivery dates. Their cycle times were actually pretty good, but their lead times were all over the place. Instead of trying to squeeze more speed out of their developers, they took a hard look at their entire workflow.
They found that up to 70% of their lead time was dead time—work waiting for someone or something. This is a common issue. By zeroing in on these delays, many Dutch manufacturers have successfully cut their lead times by as much as 30%.
The firm implemented strict WIP limits and completely redesigned its approval process. Within six months, they achieved a 30% reduction in lead time. The success had nothing to do with coding faster; it was all about optimising what happened before and after the code was written. These principles apply everywhere. For instance, things like route optimization for last-mile delivery are all about shrinking the total time it takes for a process to complete, from start to finish. For more on this, our guide on effective work flow management offers plenty of other techniques to streamline your processes.
Here are some common mistakes teams make when they start tracking metrics like cycle and lead time. Getting this wrong can lead you to draw the wrong conclusions and, frankly, waste a lot of effort. Avoiding these pitfalls is the key to getting real insights from your data—the kind that actually make a difference to your customers.
The goal isn't just to generate pretty charts for a report. It's to use data to solve genuine problems. By steering clear of these errors, you can make sure your metrics lead to meaningful, lasting improvements instead of just creating the illusion of progress.
Confusing Internal Speed with Customer Value
This is easily the most common and damaging mistake I see. A team works tirelessly to shave hours or even days off their active development process, and then they celebrate the faster cycle time as a huge win. But if a task sat in the backlog for three weeks before anyone even started that super-efficient work, what did the customer actually experience?
Not much of an improvement, that's what. A narrow focus on internal efficiency often completely misses the point of the customer's journey. A fast cycle time is great, but it only really matters if it helps shorten the overall lead time.
How to fix it: Always look at cycle time in the bigger picture of lead time. A great way to do this is with value stream mapping, where you visualise the entire process from the initial request all the way to delivery. This makes it painfully obvious where the real delays are—and spoiler, it's often the waiting periods between steps. This helps you focus your energy where it'll have the biggest impact for the customer.
Relying on Averages and Ignoring Variability
Averages can be dangerously misleading. Your average lead time might look perfectly healthy, but it can easily hide massive swings in delivery times that make your process feel unpredictable and unreliable. A team with an average lead time of 10 days could have some work finishing in two days and other work taking thirty. Good luck making any promises to stakeholders with numbers like that.
For most customers, predictability is far more valuable than raw speed. When delivery times are all over the place, it erodes trust and makes it impossible for anyone to plan ahead.
A stable, predictable process, even if it’s a little slower on average, is more valuable than a fast but chaotic one. Averages hide the outliers, and the outliers are usually what cause the most pain for your customers and your team.
Using Metrics for Individual Performance Reviews
This one is a deal-breaker. If you use cycle time or lead time to judge individual developers, you're making a massive mistake that can poison your team's culture and wreck your data. These are system metrics, designed to show you the health of the entire workflow—not the output of a single person.
The moment people feel they're being judged by these numbers, they'll start gaming the system. It's just human nature. You'll see behaviours like cherry-picking the easiest tasks, rushing work and cutting corners on quality, or just messing with ticket statuses to make the numbers look good. Your data becomes useless, and collaboration goes right out the window.
How to fix it: Treat these metrics like diagnostic tools for your process, not for your people. Frame the conversation around questions like, "What's slowing our system down?" instead of "Why is your cycle time so high?" This approach builds a culture of shared ownership, where everyone works together to fix the system.
Frequently Asked Questions
Getting into the nitty-gritty of cycle time vs lead time usually sparks a few practical questions. Let's tackle some of the most common ones that pop up when teams start trying to get their workflow into shape.
Clarifying these points helps everyone use the same language and focus their energy on fixing the right problems—moving the conversation from "what does this mean?" to "how can we solve this?"
Can Cycle Time Ever Be Longer Than Lead Time?
No, that's impossible by definition. Think of lead time as the entire journey from the customer's request to the final delivery—it's the full experience from their perspective.
Cycle time is just one part of that journey: the specific period when your team is actively working on the task. Because of this, cycle time can only ever be a subset of lead time. At most, it can be equal to it (if work starts the instant a request comes in), but it can never be longer. If your numbers are showing otherwise, it's a sure sign that your start or end points for one of the metrics are off.
Which Metric Is More Important for My Team to Track?
They're both vital, but they speak to different people and answer different questions. For your customers and the business as a whole, lead time is king. It directly measures how long a customer has to wait to get what they asked for.
Lead time tells you what the customer experiences, while cycle time helps you diagnose why they experience it.
Cycle time is more of an internal diagnostic tool. It’s what your team uses to pinpoint bottlenecks and smooth out the bumps in your active development process. The best approach is to track both. Use lead time as your main indicator of success, and then dig into your cycle time data to fix the issues that are making it balloon.
What Is a Good Cycle Time for a Software Team?
This is a classic question, but there's no magic number. Chasing a universal benchmark for a "good" cycle or lead time is a common trap that sends teams down the wrong path.
What's valuable is entirely dependent on your context—your industry, the complexity of your work, your team's structure, and even your tech stack. Instead of comparing yourself to an arbitrary external number, the goal should be continuous improvement. Focus on establishing a stable baseline from your own data, then work together to make your metrics shorter and, just as importantly, more predictable over time.
Ready to stop guessing and start seeing how your team’s time is really spent? WhatPulse offers privacy-first analytics to help you measure workflow metrics without intrusive monitoring. Find out how WhatPulse can give you the data you need to reduce cycle and lead time.
Start a free trial