Exporting data
The WhatPulse Professional dashboard allows you to export your data in CSV format for further analysis or reporting. This guide covers how to export data from various sections of the dashboard, including computers, users, applications, and pulses. It also explains how to use filters to customize your exports and provides tips for working with the exported files.
Overview
CSV exports are available across multiple areas of WhatPulse Professional, allowing you to:
- Export complete datasets without pagination limits
- Apply filters to export only the data you need
- Analyze data in spreadsheet applications
- Create custom reports based on your organization's requirements
Exporting chart data
Each activity chart includes an export button that allows you to download the raw data as a CSV file. The export button appears in the top-right corner of each chart when you hover over it. Click the export button to instantly download a CSV file containing all the data points displayed in the chart, including timestamps (grouped by day or hour) and activity metrics such as keys, clicks, scrolls, uptime, network traffic, and mouse distance. The exported data matches exactly what you see in the chart, making it easy to perform further analysis in spreadsheet applications or integrate the data into your own reporting tools.
Exporting application usage data
Currently, it is possible to export application usage data for a specific user in your organization. This includes the number of keys pressed, clicks, download volume, upload volume, scroll count, mouse distance, and usage time. To export application usage data:
- Navigate to a user's dashboard or your own dashboard
- Select the Applications tab
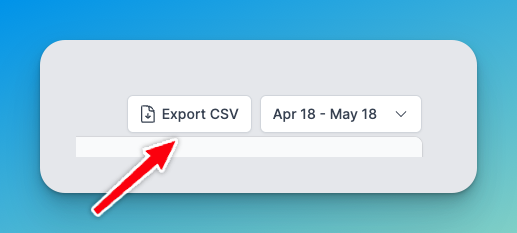
- (Optional) Set a time range using the date range picker, or use the search box to filter by application name
- Click the Export CSV button above the applications table in the top-right corner
- The CSV file will download automatically with all application data for the selected time period and/or filters
Exporting a list of computers
Organization administrators can export a list of all computers in your organization. This is useful for generating reports, or sharing data with other team members. To export a list of all computers in your organization:
- Navigate to the Computers page
- (Optional) Use the search box or tag filters if you want to filter the data
- Click the Export CSV button in the top-right corner
- The CSV file will download automatically with all computer records matching your filters
Exporting a list of users
Organization administrators can export a list of all users in your organization. To export a list of all users in your organization:
- Navigate to the Users page
- (Optional) Apply any desired search filters
- Click the Export CSV button in the top-right corner
- The CSV file will download automatically with all user data matching your filters
Exporting pulses
It is possible to export pulse data for a specific user in your organization. This includes the number of keys pressed, clicks, download volume, upload volume, scroll count, mouse distance, and usage time. To export pulse data:
- Navigate to a user's dashboard or your own dashboard
- Select the Pulses tab
- (Optional) Set a time range using the date range picker
- Click the Export CSV button above the pulses table in the top-right corner
- The CSV file will download automatically with all pulse data for the selected time period and/or filters
Understanding export filters
When exporting data, you can apply various filters to customize the exported dataset. This allows you to focus on specific records that are relevant to your analysis or reporting needs. Exports respect all active filters:
- Search filters: Only data matching your search terms will be exported
- Tag filters: Only data with the selected tags will be exported
- Date range filters: Only data within the selected date range will be exported
- Sorting: The export follows your current sort order
Unlike the web interface, exports include all matching records, not just the current page.
Working with exported files
After downloading your CSV file, you can open it in any spreadsheet application that supports CSV format, or process it in a business intelligence tool. Here are some tips for working with the exported data:
- Open it in your preferred spreadsheet application (Excel, Google Sheets, Numbers, etc.)
- The first row contains column headers for easy identification
- Use your spreadsheet application's features to:
- Sort and filter data
- Create pivot tables for deeper analysis
- Generate charts and visualizations
- Perform calculations on numeric data
For larger datasets, consider using database, business intelligence tools, or programming languages for more advanced analysis.
Export functionality is only available to users with appropriate permissions. Regular users can only export their own data, while administrators can export organization-wide data.