
A Log Analytics Workspace is a central location for your organization's machine data. It's a dedicated environment inside Microsoft Azure that collects, analyzes, and lets you act on telemetry. As part of Azure Monitor Logs, it is designed to be a single source for activity across cloud services, on-premises servers, and user endpoints.
In short, it’s the one place you can go to see all your operational data.
The Central Hub for Your IT Data
A Log Analytics Workspace is not just a database. It's an environment built to collect and interpret machine data from multiple sources. This includes performance metrics, event logs, security alerts, and custom application data.
By funneling this information into one place, you can stop chasing disconnected, siloed alerts. Instead, you get a single, unified view of your entire digital infrastructure.
A Detective's Evidence Board
Think of it like a detective's evidence board. You have separate clues: a footprint, a witness statement, a grainy security camera photo. A single clue might not mean much. When you pin them all to the board, you see connections and the full story emerges.
A Log Analytics Workspace does the same for your IT environment.
- Performance counters from a server are one clue.
- Application error logs from a user's laptop are another.
- Security events from your network firewall add more detail.
When you bring these data points together, you can correlate them. That performance spike on a server might directly line up with a burst of application errors on user machines. Without a central "evidence board," connecting those dots is a slow, manual chore. With it, you can spot problems before they escalate.
More Than Just Storage
The workspace gives you more than a place to dump logs. It's an active environment with built-in tools for analysis. Its purpose is to make large volumes of operational data easy to query and act on. You can investigate incidents, monitor performance trends, and create automated responses to specific events. Learn more about how this works in our guide to real-time monitoring.
This kind of centralization is becoming standard. The global log management market is expected to reach USD 8.99 billion by 2031, largely because businesses need better observability and analytics. In Europe, this growth is also pushed by compliance rules like GDPR, which require clear and accessible audit trails. For businesses in the Netherlands running hybrid IT setups, a unified log management strategy is necessary for efficiency and compliance.
A Log Analytics Workspace changes how you approach IT management. You move from being reactive—putting out fires—to being proactive. You analyze trends across your entire system to anticipate issues before they happen. It’s the difference between firefighting and fire prevention.
Here’s a breakdown of the workspace's main jobs.
Core Functions of a Log Analytics Workspace
This table summarizes the primary capabilities a Log Analytics Workspace provides for IT operations.
| Function | Description | Primary Benefit |
|---|---|---|
| Data Aggregation | Collects logs and metrics from diverse sources like Azure services, virtual machines, and on-premises servers. | Creates a single, unified view of the entire IT infrastructure, breaking down data silos. |
| Querying & Analysis | Uses the Kusto Query Language (KQL) to search, filter, and analyze massive datasets in near real-time. | Enables deep troubleshooting, incident investigation, and performance analysis. |
| Visualisation | Integrates with tools like Azure Dashboards and Power BI to create charts, graphs, and visual reports from log data. | Makes complex data easy to understand, helping to spot trends and anomalies quickly. |
| Alerting | Allows you to create rules that trigger alerts based on specific query results or performance thresholds. | Provides proactive notifications of potential issues, enabling faster response times. |
This centralized system gives IT leaders a clear picture of how their infrastructure is performing. It allows them to make data-driven decisions that improve reliability, security, and the end-user experience.
How Your Data Flows into the Workspace
To get value from analytics, you have to trust the data. That means knowing how it gets from a user's computer into a query you can run. This is a clear, controllable pipeline you set up.
Let's follow a single log entry on its journey, starting from an endpoint—an Azure Virtual Machine or a physical server in your Amsterdam office—and ending up as an insight in your Log Analytics Workspace.
The trip begins with the Azure Monitor Agent (AMA). It's a lightweight piece of software installed on your machines with one job: to securely gather specific data and send it to your workspace.
Once installed, the AMA doesn't just grab everything. It needs instructions. That's where Data Collection Rules come in.
The Role of Data Collection Rules
A Data Collection Rule (DCR) is the filter for your data pipeline. It's a configuration you create in Azure that tells the AMA what to collect and where to send it. You don’t want every informational event from every machine; that would be a noisy, expensive mess.
A DCR acts as a smart filter at the source. It lets you define:
- What to collect: You can pick specific Windows Event Logs, Linux Syslog events, performance counters like CPU usage, or custom text logs from your applications.
- What to ignore: You can filter out low-value noise before it leaves the machine. This helps control costs. For example, you might decide to only collect events logged as 'Warning' or 'Error'.
- Where to send it: The DCR points the agent to the right destination, which is the Log Analytics Workspace.
This gives you granular control. You could have one strict DCR for critical production servers that gathers detailed performance data, and a more relaxed DCR for employee workstations. This ensures you only pay to store the data you need.
This diagram gives a simple overview of the process, from collection to visualization.
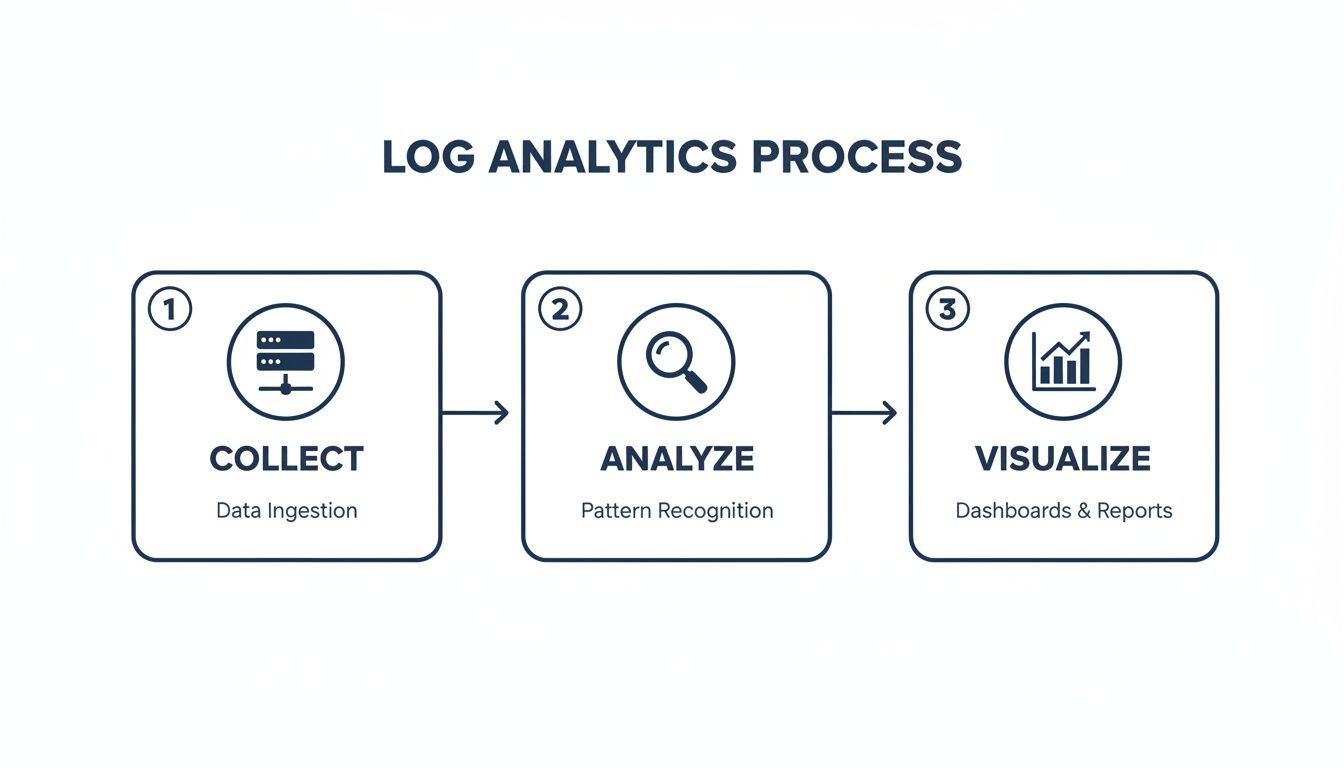
The flow is straightforward. Data is gathered, you analyze it with queries, and then you present it in dashboards or reports.
From Ingestion to Actionable Insight
Once the AMA sends the data, it hits the Azure Monitor pipeline. Here, it gets parsed, indexed, and made ready for you to query in your Log Analytics Workspace, usually within minutes. This is when raw data becomes structured, searchable information.
The data in your workspace isn't just for viewing; it can be used by other Azure services to build a more responsive IT environment.
A well-configured data pipeline fuels automation. The goal is to connect an event on a user's machine directly to an automated resolution, often without human intervention.
Take Microsoft Sentinel. It's a security tool (a SIEM) that sits on top of your workspace. It uses the log data you're collecting to hunt for threats. If it spots a pattern of suspicious login attempts on a server, it can raise an alert automatically.
Similarly, Azure Automation can use the data to trigger scripts, or 'runbooks'. If performance counters show a server's disk space is low, a runbook could automatically clear temporary files. This turns your Log Analytics Workspace from a passive reporting tool into a core part of your operational strategy.
Understanding this flow—from endpoint to automated action—gives you the confidence to build smart, efficient data collection policies. If you're looking for more details on tracking software usage, you can find an introduction to the concepts of input analytics in our documentation.
Getting Data In and Pulling Insights Out with KQL
A Log Analytics Workspace is an empty container until you fill it with data. The real work is turning that raw information into direct answers. This involves two main jobs: ingestion (getting data in) and querying (pulling insights out).

First, we'll cover common ways to feed data from your endpoint devices into the workspace. Then, we'll look at asking questions of that data using the Kusto Query Language (KQL). KQL is a practical, everyday tool for any IT professional.
Configuring the Azure Monitor Agent
The main way to get telemetry from your Windows and macOS devices is through the Azure Monitor Agent (AMA). This agent works with Data Collection Rules (DCRs) to grab the specific data you need.
Setting this up involves a few stages:
- Agent Installation: You can deploy the agent across your fleet at scale using tools like Azure Arc for on-premises servers or Microsoft Intune for user endpoints. This provides consistent coverage.
- DCR Creation: You define a DCR in the Azure portal. This is where you tell the agent what to collect. For example, you might decide to only gather 'Error' and 'Warning' events from the Windows 'System' event log.
- Machine Association: You link your DCR to a specific group of machines. This tells the agents on those devices to start sending the data you defined.
This agent-first approach is efficient. It filters noise on the endpoint, meaning you only pay to ingest and store the data that matters.
Sending Custom Application Logs
Sometimes, the most valuable data comes from your internal applications. Standard agents won't know how to pull logs from your custom software, so you need a different method: the HTTP Data Collector API.
This API gives you a secure endpoint where you can send custom log data formatted as JSON. Your developers can add code to an application to send specific events to your workspace. For instance, a custom CRM could send a log entry every time a user saves a new contact or generates a report.
This method provides another level of visibility, showing you how your custom-built tools are being used, where they might be failing, and which features are most popular.
Your First Steps with Kusto Query Language (KQL)
Once data is flowing into your workspace, you need a way to ask it questions. That’s where the Kusto Query Language (KQL) comes in. KQL is a read-only query language designed to be easy to learn but powerful enough to search massive datasets in seconds.
A KQL query has a simple structure. You start with a data source—usually a table name—and then pipe it through a series of operators that filter, shape, and summarize the results.
Think of KQL like building with LEGO bricks. You start with a big box of pieces (your data table) and then add other pieces (operators) one by one to build what you want to see. Each operator refines the result of the previous one.
The pipe character (|) is the heart of KQL. It takes the output from the left side and uses it as the input for the right side. Let’s look at some practical examples you can adapt for your own use cases.
Practical KQL Queries for IT Operations
These queries are designed to solve real-world IT problems. You can run them directly in the 'Logs' section of your Log Analytics Workspace—just change the table and column names to match your own data.
Example 1: Find Devices with an Outdated Application
Imagine you need to find every machine running an old version of Google Chrome. If you’re collecting software inventory data into a table named SoftwareInventory, the query is straightforward:
SoftwareInventory
| where SoftwareName == "Google Chrome" and isnotempty(SoftwareVersion)
| where SoftwareVersion < "125.0"
| summarize by Computer, SoftwareVersion
This query first finds all records for "Google Chrome," then filters again for any version older than 125.0. The summarize command then gives you a clean list of each computer and the outdated version it's running.
Example 2: Track Usage of a Specific Internal Application
Let's say you've sent logs from your internal CRM application to a table called CustomAppLogs_CL, and you want to see who the power users are.
CustomAppLogs_CL
| where AppName == "InternalCRM" and EventType == "ReportGenerated"
| summarize ReportCount = count() by UserName
| top 5 by ReportCount
Here, we look for a specific event, ReportGenerated. The summarize operator counts how many reports each user generated, and top 5 shows you only the most active people. This kind of query is good for understanding tool adoption. If you need a more advanced view, exploring options for searching and filtering your data can provide even deeper insights.
Example 3: Identify Unusual Network Activity
You can also use KQL to hunt for potential security issues. If you're collecting network connection data, you could find processes making an unusually high number of outbound connections.
NetworkConnections
| where Direction == "outbound"
| summarize ConnectionCount = dcount(RemoteIP) by SourceProcessName, Computer
| where ConnectionCount > 50
| order by ConnectionCount desc
This query counts the number of distinct remote IP addresses (dcount(RemoteIP)) that each process is connecting to. If a common process like svchost.exe is suddenly talking to hundreds of different IPs, that’s a red flag worth investigating. A simple query like this can help you spot misconfigurations or malware.
These examples are just the beginning. KQL lets you join different tables, create time-series charts, and perform complex statistical analysis, all with a direct syntax. It’s the key that unlocks the value of all the data you’ve gathered.
Controlling Costs and Managing Data Retention
A Log Analytics Workspace can pull in enormous amounts of data. That strength can become a weakness for your budget if you're not careful. Without a plan, costs can grow as fast as the data flows in.
Understanding the pricing model is the first step. Your bill is based on two main things: data ingestion (how much data you send in) and data retention (how long you keep it). Every gigabyte you collect has a price, and every gigabyte you store for another month adds to the bill.
This means the best way to manage spending is to be deliberate about what data you collect and how long you hold onto it.
Practical Strategies for Cost Optimisation
You have a few direct controls to keep costs predictable. Using even one or two of these can affect your monthly Azure bill.
Here are three of the most effective tactics:
- Set a daily ingestion cap. This is your primary safety net. You can set a hard limit on how much data your workspace will accept each day. If you hit that cap, ingestion stops until the next day. This prevents a misconfigured agent from sending terabytes of logs and creating a large, unexpected bill.
- Filter data at the source. Why pay to ingest data you'll never use? With Data Collection Rules (DCRs), you can filter out noisy, low-value logs before they leave the endpoint. For example, you could tell the agent to only send events with a severity of 'Warning' or 'Error', ignoring all the informational logs.
- Use ingestion-time transformations. For more fine-grained control, you can apply a KQL query directly to the data stream as it arrives. This lets you drop specific columns or entire records that match certain criteria, ensuring you only pay to store clean, relevant data.
These challenges aren't unique to Azure. The core principles of managing log data apply across platforms. Exploring strategies for reducing cloud log costs in other environments can give you parallel insights for keeping your Log Analytics Workspace expenses in check.
Designing Your Data Retention Policy
Not all data has the same value, and its value changes over time. The logs from a critical security incident are important for the first few weeks, but their day-to-day relevance fades. A tiered retention strategy helps you align storage costs with the data's lifecycle.
You can set different retention periods for different types of data. A common policy might look like this:
- Interactive Retention: Keep the last 30-90 days of data in the "hot" tier. This is your instantly queryable data for active troubleshooting and daily operational checks.
- Archive: After 90 days, automatically move the data to the Archive tier. Archived data is much cheaper to store, but you can't query it directly. If you need to analyze it, you have to restore it first, which takes time.
This tiered approach gives you a practical balance. You get fast access to recent data for operational needs, while keeping long-term data for compliance or historical analysis at a lower cost.
Let's look at how to put these ideas into a clear framework.
Cost Optimization Strategies
Here's a comparison of different methods to control your workspace costs.
| Strategy | How It Works | Best For |
|---|---|---|
| Daily Ingestion Cap | Sets a hard GB/day limit on data ingestion. Once reached, ingestion stops for the rest of the day. | Preventing massive, unexpected bills from misconfigurations or log storms. It's an emergency brake. |
| Source-Side Filtering (DCRs) | Uses rules on the agent to discard low-value logs (e.g., 'Info' level events) before they are sent to the workspace. | Reducing overall ingestion volume from noisy sources without complex logic. |
| Ingestion-Time Transformations | Applies a KQL query during ingestion to drop specific columns or rows from the incoming data stream. | Fine-tuning the data you store, removing irrelevant fields or records to save on storage costs. |
| Tiered Data Retention | Automatically moves older data from "hot" (interactive) storage to cheaper "cold" (archive) storage after a set period. | Balancing immediate query needs with long-term compliance requirements at a lower cost. |
Choosing the right mix of these strategies depends on your needs, but combining a daily cap with smart filtering is almost always a good approach.
This is especially relevant in the Netherlands, where IT investment is climbing. The Dutch IT services market on mordorintelligence.com is projected to hit USD 39.11 billion by 2031, with much of that growth driven by the need for analytics and monitoring to meet standards like NIS2. Managing the costs of these systems is a critical part of a successful implementation.
Controlling the cost of a Log Analytics Workspace comes down to good governance. By setting firm limits, filtering aggressively, and building a smart retention policy, you can get the analytical power you need without letting your budget get out of hand.
Real-World Use Cases for Endpoint Analytics
A Log Analytics Workspace is a tool for solving business problems. Its value appears when you start writing queries that answer specific operational questions. By digging into endpoint data, you can shift from reacting to fires to proactively managing your environment, turning raw logs into decisions that save money and improve user experience.
Here are three practical scenarios that show how to put your workspace to use for endpoint analytics. Each one includes a sample KQL query you can adapt.
Optimise Software Asset Management
A quick way to see a financial return is by managing software assets. Companies often overspend on software licenses that employees rarely use. A simple KQL query against your application usage logs can pinpoint which licenses are unused.
Imagine you want to find every installed copy of a pricey design tool that hasn't been opened in the last 60 days. That information lets you reclaim expensive licenses and reallocate that budget.
Example KQL Query for Unused Software
AppUsage
| where AppName == "PremiumDesignSuite"
| summarize LastUsed = max(TimeGenerated) by Computer, UserName
| where LastUsed < ago(60d)
| project Computer, UserName, LastUsed
This query looks through your AppUsage table for the specific application, finds the last time it was used for each person and computer, and then filters the list to show only those who haven't launched it in two months. The result is a clean, actionable list to start your license harvesting.
You can apply the same logic to enforce version control, identifying every device running an outdated and insecure version of an application so you can target them for an update.
Troubleshoot Application Performance
When a new software update goes live and the helpdesk gets busy, a Log Analytics Workspace can help. Instead of deciphering vague user reports like "the app feels slow," you can get to the root cause with hard data.
Let's say the finance team reports that a recent update to their accounting software is causing performance problems. You can check the endpoint logs to compare performance metrics from before and after the rollout.
Example KQL Query for Performance Issues
Perf
| where Computer startswith "FIN-" and CounterName == "% Processor Time"
| where ObjectName == "Process" and InstanceName == "AccountingApp#1"
| summarize AvgCPU = avg(CounterValue) by bin(TimeGenerated, 1h), Computer
| render timechart
This query focuses on computers in the finance department (those with the "FIN-" prefix), isolates the CPU usage for the specific accounting app, and then charts the average CPU load over time. If you see a sharp spike right after the update, you have a clear signal that the new version is the cause.
This kind of objective evidence transforms a guessing game into a focused investigation. Endpoint analytics are also important for leveraging event logging for cybersecurity, giving you vital insights into potential threats.
Gain Productivity Insights
Beyond technical issues, endpoint data can reveal how teams work and where they encounter digital friction. By analyzing application usage patterns, you can see how well a new tool is being adopted or spot workflows that need improvement.
This is part of a growing field. The workplace analytics market is expected to reach USD 6.7 billion by 2033, as more businesses look to optimize their software investments and understand work patterns. For IT leaders in the Netherlands, these insights offer a strategic edge in managing resources.
The goal is not to monitor individuals, but to see the big picture. Are people constantly juggling three different chat apps? Is that new project management tool actually being used, or are teams still using old spreadsheets?
Example KQL Query for Tool Adoption
AppFocus
| where AppName in ("NewProjectTool", "OldSpreadsheetApp")
| summarize TotalFocusTime = sum(FocusDuration) by AppName, Department
| order by Department, AppName
This query measures the total time an application is in the foreground (its "focus time") and groups it by department. It gives you a side-by-side comparison showing which departments are embracing the new tool and which are still using the old one. With that knowledge, you can offer targeted training where it's needed most.
These examples are just a start, but they show how a Log Analytics Workspace turns endpoint logs into business intelligence. It provides the proof you need to make smarter decisions on software spending, performance, and productivity.
Common Questions About Log Analytics Workspace
When first using Log Analytics Workspaces, a few questions often come up. Understanding these early on helps build a solid foundation. Here are answers to some of the most frequent ones.
Should I Use a Single Workspace or Multiple Workspaces?
Start with one. For most organizations, a single workspace is the cleanest and most efficient approach. It simplifies management and lets you see the bigger picture by connecting data from all your different sources in one place. You can write one query to join server performance data with application logs and security events—something that is harder when your data is scattered.
There are good reasons to use more than one. You might need separate workspaces for specific requirements:
- Data Sovereignty: If you operate in different countries, you might be legally required to keep data within a specific border. A workspace in a German datacentre for German data and another in a Dutch datacentre for Dutch data is a common way to comply with rules like GDPR.
- Billing Separation: Different departments or clients may need their cloud costs billed separately. A dedicated workspace for each can make that cost allocation cleaner.
- Strict Access Control: While you can use role-based access control (RBAC) to restrict who sees what in a single workspace, some organizations prefer the hard boundary that separate workspaces provide.
Unless you have a clear need for one of those scenarios, stick with a single workspace. It’s easier to manage and more powerful for analysis. You can add more later if your needs change.
What's the Difference Between Log Analytics and Azure Data Explorer?
This is a common point of confusion. Both services use the Kusto Query Language (KQL) and are built on the same core engine. The difference is their purpose and how much of the setup you have to do yourself.
Think of it like this: a Log Analytics Workspace is a fully furnished apartment, while Azure Data Explorer is a plot of land where you build your own custom house.
A Log Analytics Workspace is a specialized, fully managed solution for IT operations, security, and performance monitoring. It’s ready to use with built-in connectors, pre-made data structures, and deep integrations with tools like Microsoft Sentinel. It’s the right tool for the job 95% of the time for standard IT telemetry.
Azure Data Explorer (ADX) is a raw, high-performance big data analytics platform. It gives you more control over the underlying infrastructure, including the compute clusters that power your queries. This makes it a good fit for specialized projects, like analyzing massive streams of data from IoT devices or building a custom telemetry platform for a commercial software product.
For most IT monitoring and endpoint analytics, a Log Analytics Workspace is the simpler and more direct choice.
How Does This Workspace Support GDPR Compliance?
A Log Analytics Workspace gives you the tools to build a GDPR-compliant monitoring setup, but compliance is your responsibility. The platform itself doesn't make you compliant; how you use it does.
The workspace provides several features to help you meet your obligations:
- Data Residency: You pick the Azure region for your workspace, which lets you ensure all your log data is stored and processed within the EU.
- Access Control: Azure's role-based access control (RBAC) allows you to enforce the principle of least privilege, making sure only authorized people can access or query specific data.
- Data Purge: The service includes an API to permanently delete specific records from your tables. This is a tool for honoring "right to be forgotten" requests under GDPR.
You are still in control of the most important pieces. It’s up to your organization to define what data to collect, set the right retention policies, and manage access correctly. You have to ensure you aren’t collecting unnecessary personal data from endpoints and that your policies align with your legal duties.
WhatPulse offers a privacy-first approach to endpoint analytics, helping you understand application usage and productivity without breaking employee trust. Our platform gathers the data you need to optimise software spending and improve workflows, all while sticking to strict GDPR standards. Discover how WhatPulse can bring clarity to your IT operations.
Start a free trial