

Good managers are multipliers. They don't just manage tasks; they make their entire team more effective.
Their performance isn't found in their personality or the hours they work. It's in the outcomes and the health of the people they lead. This impact isn't invisible—you can track it.
What Good Manager Performance Looks Like
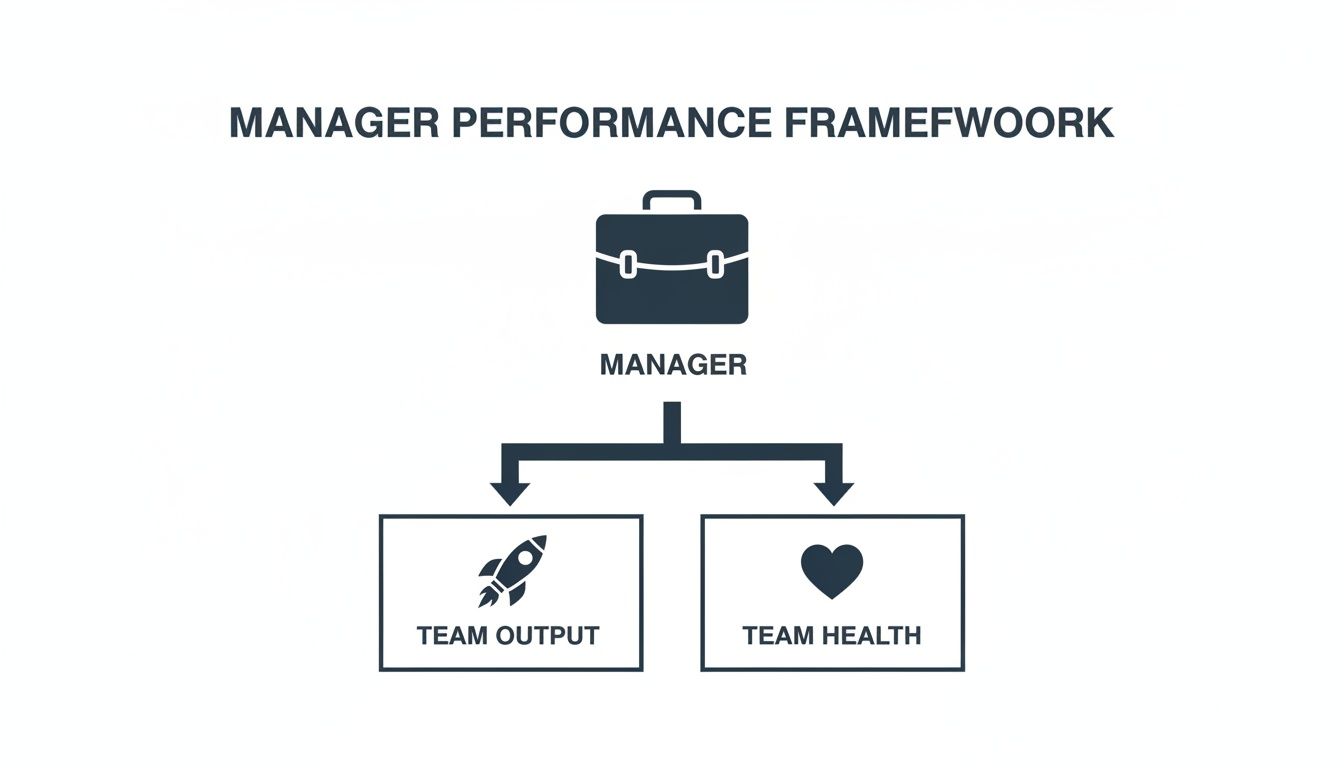
A manager’s performance shows up in two areas: their team's output and their team's health.
You can't have one without the other for long. A team that ships high-quality work but is bleeding talent is not a sign of a good manager. A happy, comfortable team that fails to deliver is also a problem.
Good management creates an environment where both can happen. This pulls the conversation about manager performance away from subjective feelings and into objective outcomes.
The Two Pillars of Manager Performance
Managers must balance the needs of the business with the needs of their people. This becomes clear when you separate their impact into two categories.
- Team Output: The "what." This covers the quantity and quality of the work the team produces. This includes delivery speed, project success rates, and the team's throughput.
- Team Health: The "how." This measures the sustainability and well-being of the group. Key signals here include employee retention, engagement levels, and collaboration within the team and with other departments.
A manager who addresses both builds a team that is productive, resilient, and motivated. This is where the multiplier effect happens. Great managers don't just complete tasks; they build a system that produces great results.
A manager's job is to create more value than they consume. If a manager isn't making their team more capable, autonomous, and productive, they are a net cost to the organisation.
Part of being a good manager is knowing how to resolve issues before they spiral. Building a healthy team environment requires skill in handling employee complaints and building psychological safety.
This is a core competency that prevents people from leaving and keeps the team focused on work. By addressing friction and removing obstacles, a manager ensures the team's energy is pointed toward its goals, not internal conflicts.
Defining Core Manager Performance Metrics
To measure a manager's performance, looking at simple things like tasks completed doesn't work. An effective manager creates an environment where the team performs better. Their impact shows up in specific, measurable ways that are hard to fake.
You can think of a manager's role as having two responsibilities: driving the team's output and looking after the team's health.
These two things are linked. You can't sacrifice one for the other and expect a sustainable, high-performing team. A good manager knows how to strike a balance to get results without burning everyone out.
So, how do you measure this? Let's break it down into a few areas and the metrics that tell the real story.
Key Performance Indicators for Technical Managers
For teams in IT, engineering, or product, performance is a mix of speed, quality, and efficiency. The table below outlines some reliable KPIs to get a clear picture of how a manager is doing. These reflect a manager's ability to create a healthy, productive workflow.
| Category | Metric | What It Measures |
|---|---|---|
| Team Velocity | Cycle Time | How long it takes to get work from 'started' to 'done'. Shorter times mean fewer roadblocks. |
| Team Velocity | Deployment Frequency | How often the team ships code. More frequent, smaller deployments often signal a healthy agile process. |
| Quality & Stability | Change Failure Rate | The percentage of deployments that cause a production failure. A low rate points to solid quality control. |
| Quality & Stability | Mean Time to Recovery (MTTR) | How quickly the team fixes things when they break. A low MTTR shows the team is prepared and resilient. |
| Resource Optimisation | Software Licence Utilisation | Whether the tools the company pays for are actually being used, indicating responsible budget management. |
These numbers give you a starting point. They help move the conversation from "Are we busy?" to "Are we effective?".
Measuring Team Velocity and Throughput
Velocity metrics are about how efficiently a team gets work done. They offer a window into a manager’s ability to clear roadblocks, streamline processes, and keep their team focused. These are direct signs of operational effectiveness.
Here are a few worth tracking:
- Cycle Time: This is a big one. It measures the total time from when someone starts a task to when it’s delivered. If cycle time is consistently low or trending downwards, the manager is successfully smoothing out the workflow.
- Deployment Frequency: How often does the team ship code or updates? More frequent, smaller deployments usually point to a healthy, agile process.
- Work In Progress (WIP) Limits: While not an output metric itself, seeing if a team sticks to its WIP limits shows discipline. A manager who enforces these limits prevents the context-switching and burnout that kills productivity.
For example, a manager notices cycle times are creeping up. They investigate and find the team is bogged down in too many meetings. By introducing a "no-meeting Wednesday," they create a block of uninterrupted focus time. The result is a measurable drop in cycle time for that week's tasks. That’s effective management.
Indicators for Quality and Stability
Going fast is pointless if everything breaks. A manager's performance is also tied to the quality and reliability of what their team produces. These metrics show whether a manager is playing the long game instead of chasing short-term wins.
High-quality output is a direct result of a well-managed process. Rushed, unstable work often points to a manager who is pushing for speed at the expense of sustainable practices.
Key quality metrics include:
- Change Failure Rate: What percentage of deployments leads to a failure in production? A low rate shows the manager has put effective testing and QA processes in place.
- Mean Time to Recovery (MTTR): When a failure happens, how fast can the team get things back online? A low MTTR indicates a well-prepared team with clear emergency procedures—something a good manager builds and practises.
- Bug Resolution Time: How long does it take the team to fix bugs once they’re reported? Quick turnaround times show the manager prioritises quality and is responsive to issues.
Imagine a team whose change failure rate is rising. A data-driven manager would pause and find out why. Maybe developers are skipping code reviews to hit deadlines. The manager could then reinforce the review process, even if it slows deployment frequency for a bit, to bring stability back. That decision reflects their performance.
Optimising Resources and Tools
A good manager is a steward of the company's resources. They make sure the team has the right tools for the job without wasting money on software that no one uses. This is an often-overlooked part of a manager’s job, but it directly affects the bottom line. Our guide on essential human resource KPIs offers more context.
Think about software licence utilisation. Many organisations pay for hundreds of licences that gather digital dust. A savvy manager can use digital activity data to spot these idle licences and redirect that budget to tools the team needs. This is about making sure every dollar spent helps the team do their best work.
Looking Beyond Numbers with Qualitative Signals
Numbers tell you part of the story, but they can't capture everything about a manager's performance. The best managers don't just hit targets; they create an environment where their teams can thrive. This impact is often seen in qualitative signals—the observable behaviours and attitudes within a team.
These signals are less about spreadsheets and more about the day-to-day reality of work. A team that feels safe enough to experiment, fail, and speak up is almost always led by a manager who has intentionally built that trust.

Assessing Team Autonomy and Ownership
One of the surest signs of good management is a team that doesn't need constant supervision. When people take ownership of their work, spot problems, and propose solutions on their own, you know their manager has empowered them.
You can spot autonomy by looking for these signs:
- Proactive Problem-Solving: Team members flag issues and start sketching out a solution before their manager knows there’s a problem. They don’t just report roadblocks; they present ways forward.
- Reduced Manager Dependency: The team can make decisions and move work along without waiting for approval on every detail. Communication shifts from "Can I?" to "Just so you know..."
- Distributed Knowledge: Information isn't hoarded by one or two senior people. Knowledge is shared openly, allowing different team members to step up and lead initiatives.
This isn’t about a manager being hands-off. It’s the result of them being effective at setting clear goals and context so the team can operate independently.
Measuring Psychological Safety
Psychological safety is the shared belief that it’s safe to take interpersonal risks on a team. It means people feel comfortable admitting mistakes, asking questions, or offering new ideas without fearing they'll be shamed or punished.
A manager is the primary architect of this environment. Without it, you get a culture of silence where problems fester and good ideas die.
A team with no conflicts is not a healthy team. It's a team where people are too afraid to speak up. The manager's job is to make constructive disagreement feel productive, not dangerous.
To get a real sense of psychological safety, you have to go beyond surface-level observations. You need structured, confidential ways to gather this kind of feedback.
Gathering Qualitative Data Effectively
You can't just ask, "Is your manager good?" That's too vague. You need to look for specific evidence through structured conversations and observations. This is how you turn an abstract concept like 'good culture' into something you can assess.
1. Skip-Level Meetings These are one-on-one meetings between a senior leader and a manager's direct reports. They create a safe space for employees to give candid feedback without their immediate manager present.
Try asking open-ended questions like:
- "What is one thing your manager could start doing to make your work easier?"
- "When was the last time your feedback led to a real change?"
- "How does the team handle disagreements or differing opinions?"
2. Observing Team Dynamics Pay attention to how the team interacts in meetings. Does one person dominate every conversation? Do people build on each other's ideas, or do they shut them down? A manager who facilitates inclusive discussions, making sure every voice is heard, is building a healthier team.
When a manager consistently unblocks their team, fosters autonomy, and builds a foundation of psychological safety, you will almost always see those efforts reflected in the numbers. The quantitative metrics show what happened; these qualitative signals explain why.
Using Digital Activity Data to Measure Manager Impact
Connecting a manager's decisions to team behaviour can feel like guesswork. Did that new daily stand-up format help, or is it just another meeting? Digital activity data, when collected and analysed responsibly, moves these questions from opinion to evidence.
This isn't about watching individuals. It’s about understanding work patterns at a team level. By looking at aggregated, anonymised data on application usage, focus time, and context switching, you can see the results of a manager’s process changes. The point is to see how a manager influences the team’s ability to work effectively, not to track keystrokes.
Establishing a Baseline for Comparison
Before you can tell if a change made a difference, you need to know where you started. Establishing a baseline is the first step. This means collecting data on your team's typical work patterns for a few weeks—say, two to four—before you roll out any new initiatives.
This baseline should capture a few behavioural metrics:
- Average Focus Time: How much uninterrupted time do team members get in their core applications without jumping between tasks?
- Context Switching Frequency: How often does the team shift between different apps or types of work? A high number is often a sign of distraction.
- Application Usage Patterns: Which tools are central to the team's workflow? Are there redundant apps or underused subscriptions you’re paying for?
This initial data set is your point of reference. It’s the "before" picture that lets you measure the "after."
Connecting Managerial Interventions to Team Data
Once you have a baseline, you can track how the data shifts after a specific managerial intervention. This is where you draw a clear line between a manager's action and the team's response.
Let’s use a classic example. A manager suspects their team is buried in meetings, which chops their day into unproductive pieces. They decide to introduce a "no-meeting Wednesday" policy to create a dedicated block for deep work.
The hypothesis is simple: Fewer meetings on one day should lead to a measurable increase in focus time and a decrease in context switching for the team. Digital activity data can prove or disprove this.
After running the new policy for a month, you can compare the Wednesday data against your baseline. Did the engineering team’s average focus time in their code editor go up? Did the number of times they switched between Slack and their development tools go down? If the data shows a positive shift, the manager's idea was a success.
This dashboard shows how aggregated team data can reveal these work patterns without touching individual privacy.
The chart visualises application usage across the team, making it easy to spot trends in tool adoption or see where the team’s collective time is going.
From Subjective Feedback to Objective Proof
This data-driven approach changes the conversation around performance. Instead of relying on gut feelings, a manager can point to objective evidence. For instance, if a manager spends time training the team on a new project management tool, you should see adoption rates climb and time spent in the old one go down.
Think about these scenarios:
- A manager streamlines the code review process. The goal is to reduce how long tickets spend in "review." Digital activity data might show less time spent bouncing between the version control system and chat apps.
- A manager reorganises team communication channels. If it works, you should see a drop in chaotic, multi-channel conversations and more focused discussions happening in the right tools.
This method gives managers a tight feedback loop to understand what works. It empowers them to experiment with process improvements and see the results almost immediately. You can learn how to optimise work patterns with data transparency and WhatPulse to improve team effectiveness.
The goal is to give managers the insights they need to build a more productive and less frustrating work environment.
Seeing Manager Performance in Action
Metrics are a good start, but the best way to understand manager performance is to look at how it’s measured in high-stakes environments. Professional sports, especially elite football, provides a relevant model. For a top-tier football manager, performance isn't a vague feeling—it’s scrutinised weekly and measured with clarity.
There’s no room for guesswork. A manager's value is directly tied to the team's results on the pitch. Success is counted in win rates, points-per-game, and league position. These aren’t lagging indicators; they are live data points that can decide a manager’s career from one week to the next.
This data-first evaluation creates a culture of accountability. Every strategic choice a manager makes—tactics, player substitutions, training routines—is tested immediately. The result is out there for everyone to see, creating a tight feedback loop between an action and its outcome.
From the Football Pitch to the Project Team
That same logic translates to the business world. A manager's decisions on team structure, workflows, and communication habits have a direct and measurable effect on what the team ships. We can turn the clear-cut metrics from sports into meaningful business KPIs.
Think about a team's performance over a season. A football manager is judged on their ability to create long stretches of success. A winning streak isn’t just luck; it's evidence of tactical skill and the ability to keep a team motivated.
On the flip side, a long spell without a win puts the manager's performance under a microscope. In the 2023–24 Eredivisie season, PSV Eindhoven went on an incredible 26-match unbeaten run. At the other end of the table, FC Volendam had a miserable 12-game winless streak. These different outcomes are almost always pinned on the effectiveness of the managers. You can dig into more performance stats from that season on ESPN.com.
Translating Sports Analytics to Business Management
The link between a manager's choices and the team's results is clear in sports. We can use this model to get a better handle on a manager’s performance in a technical team. Sustained success in business looks like a winning streak.
A manager who consistently delivers projects on time and under budget isn't just lucky. They are making a series of smart, small decisions every day that add up to a winning record.
The connection is obvious when you line up the concepts. The table below shows how the metrics from Dutch football translate to the world of business management.
| Sports Metric (Dutch Football) | What It Shows | Equivalent Business Metric | What It Shows About a Manager |
|---|---|---|---|
| Winning Streak (e.g., 17 wins) | The team executes its strategy effectively and consistently. | Consecutive Sprints On-Time | The manager is excellent at planning, removing blockers, and keeping the team focused. |
| Unbeaten Run (e.g., 26 games) | The team is resilient and avoids critical errors. | Quarters with Zero Critical Incidents | The manager has built robust processes for quality control and risk management. |
| Winless Streak (e.g., 12 games) | The team's strategy is failing, and the manager cannot adapt. | Rising Change Failure Rate | The manager may be pushing for speed over stability, leading to technical debt. |
| Points Per Game | The team's average rate of success and consistency. | Average Cycle Time | The manager’s ability to maintain an efficient and predictable workflow. |
This comparison makes one thing clear: consistent, positive outcomes are not an accident. They are the product of a well-managed system. A manager who guides their team to a "winning streak" of 10 consecutive sprints completed on time is showing high operational skill. They are managing resources, anticipating problems, and keeping their team moving forward.
Likewise, an engineering manager whose team goes four straight quarters with zero critical P1 incidents is demonstrating a mastery of quality and stability. This is the business version of an "unbeaten run." It tells you the manager has built strong testing, review, and deployment practices into the team’s DNA. Setting these initial benchmarks is the first step, and you can learn more about how to establish baseline metrics for continuous improvement to track this progress.
Thinking this way shifts manager performance reviews from a subjective annual chat to a continuous, data-informed conversation. The focus moves to tangible results and the strategic decisions that drive them, creating a clearer path for coaching and development.
Building a Unified Manager Performance Dashboard
A spreadsheet with velocity metrics next to a slide deck with employee survey results isn't a strategy. To get a true picture of a manager's performance, you need to bring everything together into a single view. The goal is a dashboard that tells the whole story, combining team output with team health.
This dashboard becomes the single source of truth for every conversation about that manager's impact. It should be designed to give a balanced perspective, showing not just what the team delivered, but how they delivered it.
Designing the Dashboard Layout
Structure is everything. A cluttered dashboard is worse than no dashboard at all. Organise the information logically, moving from high-level summaries down to granular metrics.
Here’s a practical layout:
Top-Line Summary: At the top, show the two most important numbers: a primary team output metric (like Cycle Time) and a primary team health metric (like the Employee Retention Rate for their team). These two figures give an immediate, at-a-glance sense of performance.
Team Output Section: Dedicate a section to quantitative delivery metrics. Visualise trends over time for things like Deployment Frequency and Change Failure Rate. Line graphs show the direction things are heading.
Team Health Section: Combine data from different sources. Include metrics from digital activity data, such as Team Focus Time or Context Switching Frequency. Alongside these, add a summarised score from your latest employee engagement survey.
Qualitative Feedback Summary: Add context here. Instead of copying raw comments, summarise key themes from skip-level meetings or peer reviews. A simple bulleted list with points like "Team feels empowered to make decisions" or "Concerns raised about meeting overload" provides the story behind the numbers.
Your dashboard should answer two questions at a glance: Is this team shipping effectively? And is this team sustainable? If either answer is 'no', the dashboard should point you to where the problem might be.
Using the Dashboard for Coaching
This tool isn't for pointing fingers; it's for starting productive conversations. The data provides a neutral starting point to discuss performance and focus on coaching.
When you sit down with a manager, use the dashboard to guide the discussion. For example, you might notice that Cycle Time is increasing while the team’s Focus Time is decreasing. This isn't a failure. It’s an opportunity to ask, "It looks like the team is getting more distracted. What obstacles are getting in their way, and how can I help you remove them?"
This shift changes the conversation from judgment to joint problem-solving. By grounding the discussion in objective data, you can create a clear, actionable plan for improvement.
Common Questions About Manager Performance
When you start using data to look at manager performance, a few questions always come up.
Won't This Just Encourage Micromanagement?
That's a fair question, and it's a real risk if you get it wrong. The key is to focus on team-level outcomes, not what any single person is doing.
Metrics like cycle time, deployment frequency, or how much focus time the team gets are all signals of a healthy system. They measure the manager's ability to clear roadblocks and streamline the workflow, not whether someone was at their desk. Good data turns a manager into an obstacle remover, which is the opposite of micromanagement.
The goal isn't to track individuals. It's to give managers a better lens to see their team's friction points so they can fix systemic issues.
What if Our Managers Push Back on New Metrics?
Resistance is normal. It usually comes from a fear that the data will be used to punish them. The best way to get ahead of this is to be transparent.
Bring managers into the conversation when you're choosing what to measure. Explain why a certain metric is important and how it connects to the team's success. Frame this as a coaching tool—something to help them and their teams win, not a new way to catch them making mistakes. Run a small pilot with a few managers who are open to the idea. Let them see the value first-hand, and they'll often become your biggest champions.
How Do We Balance Short-Term Delivery with Long-Term Health?
A well-designed dashboard puts this balance right in front of you. You don't have to choose one or the other. For instance, you can track short-term output like sprint velocity on the same screen as long-term health indicators like employee retention and code stability.
Imagine a manager is crushing all their short-term delivery targets, but their team's change failure rate is climbing and they've lost a key engineer. The data makes that story impossible to ignore. It flags an unsustainable pace and opens the door for a conversation about finding a rhythm that doesn't burn out the team.
Get a clear, privacy-first view of how your team really works with WhatPulse. See the true impact of process changes, find unused software, and help your managers build more focused, effective teams. Find out more at https://whatpulse.pro.
Start a free trial