
When it comes to understanding how your team works, the more flexible your data is, the better. That's why we've added CSV exports to WhatPulse Professional—so you can take your usage data into your favorite spreadsheet or reporting tool and make it work for you.
With just one click, you can now export data across several areas of your dashboard:
- Application usage for any individual user
- Pulse data with complete activity breakdowns
- Computer lists for inventory or audit reports
- User lists filtered exactly how you need them
Each export includes all matching data—no pagination limits—and respects any filters you apply, like date ranges, search terms, tags, or sort order. Whether you want a quick Excel snapshot or you're building a dashboard in your BI tool, CSV exports give you the raw data you need.
Here's how teams are already using it:
- Visualizing trends in weekly app usage
- Auditing machine activity per location tag
- Creating custom reports for internal review
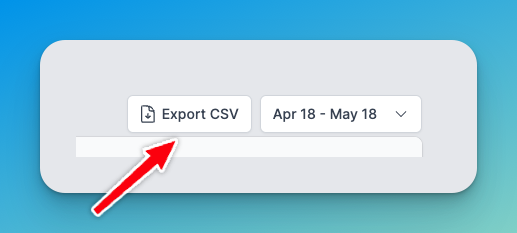
To get started, just look for the Export CSV button in the top-right corner of relevant dashboard pages with data inside tables. It's available to all users with the right permissions—admins can export org-wide data, and users can export their own.
Want to see how it works? Check out our help guide →